

The ML4T Third-Edition Code Rollout Starts Today
Between now and launch, the public repo will fill in stages: workflow, case studies, libraries, and the checks that turn model forecasts into trading decisions.

The Machine Learning for Trading repository has carried much of the practical load for ML4T. Some readers used it to run notebooks alongside the chapters. Others found the book through the code first. With more than 19,000 stars and 5,300 forks, it has become the public memory of the first two editions. It also showed up again recently on GitHub Trending for Jupyter Notebook repositories, which is a useful reminder that the old repo is still being discovered while the new edition is being prepared.
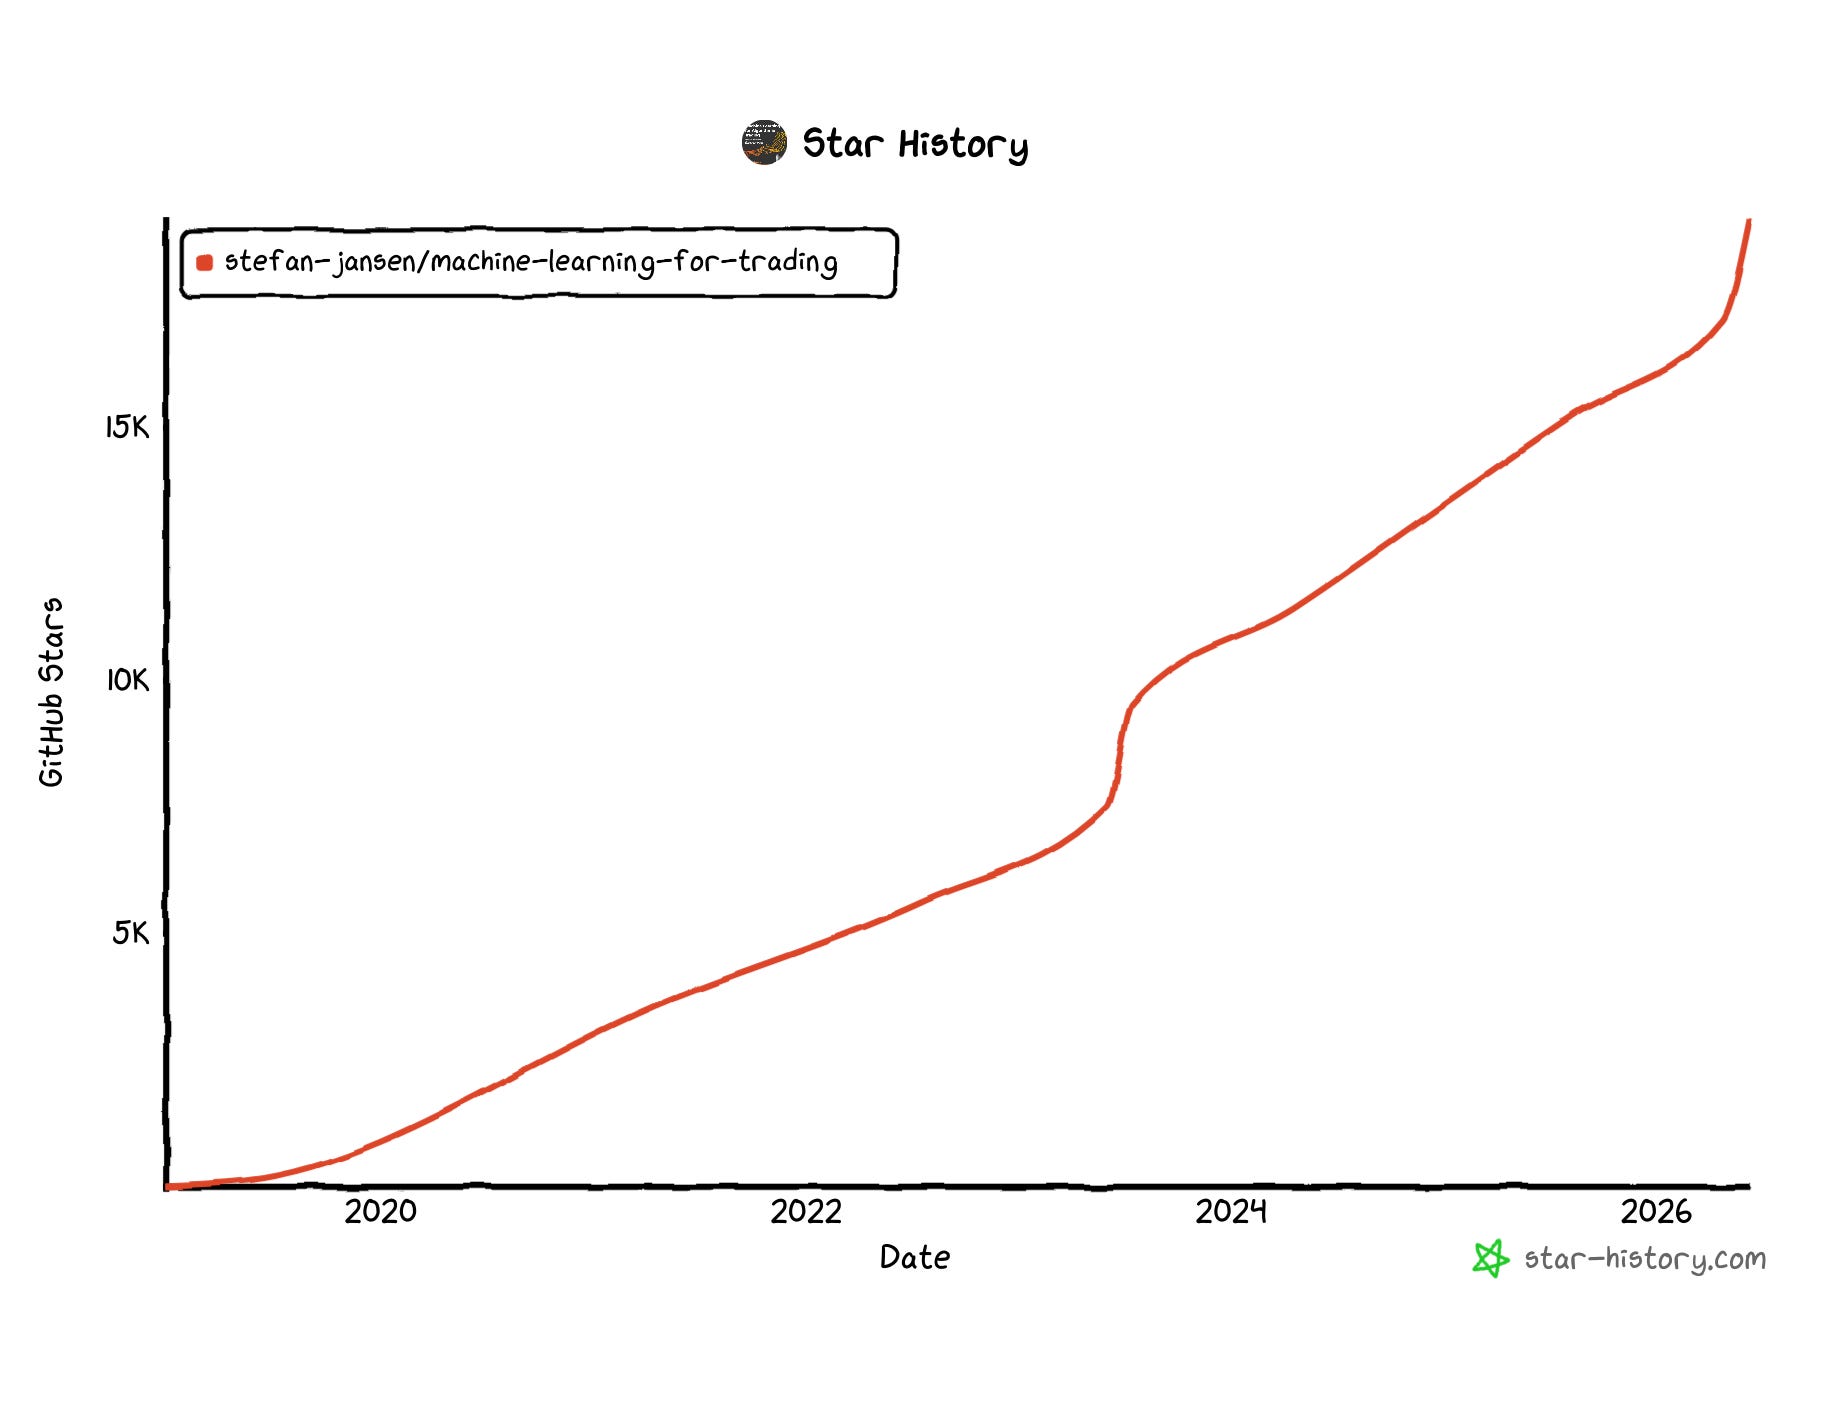
Star history for the public ML4T repository, showing steady growth from 2019 through 2026. The third-edition rebuild starts from an existing reader base that has accumulated over several years.
The third-edition README is now live on the main branch. The older material is preserved on the first-edition and second-edition branches. The new code will be rolled out in stages over the next few weeks leading up to the July launch.
That staged release has a practical reason. A large trading-ML repo can easily turn into a larger notebook archive: more models, more datasets, more examples, more ways to get lost. The third-edition rebuild is organized around a different question:
When a forecast looks promising, what has to be checked before it becomes a trading decision?
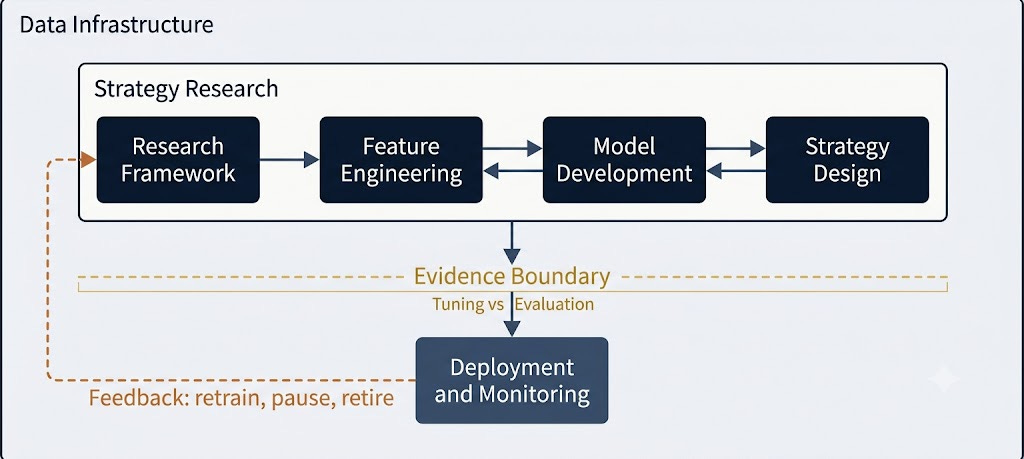
The third-edition workflow separates strategy research from evaluation with an evidence boundary, then closes the loop through deployment, monitoring, and the decision to retrain, pause, or retire a strategy.
That is also the question behind next Wednesday’s free Lightning Lesson “From trading idea to validated strategy”. The repo is the public resource; the lesson is the short guided walkthrough.
The work after the forecast
A familiar research sequence goes like this. A model produces a plausible return forecast. The validation IC improves. A backtest looks better than the baseline. Then the harder checks begin.
Was the asset universe fixed before the test? Did the label line up with what was knowable at the time of the decision? Were overlapping labels handled correctly? How many variants were tried before this one survived? Did the result clear the cost model? Did turnover make the signal unusable? Does the portfolio rule amplify a weak forecast or diversify it? What happens after position limits, drawdown rules, and execution assumptions are applied?
The book calls one part of this the evidence boundary: the line between exploration and confirmation. On one side, you search, tune, compare labels, test feature families, and improve the baseline. On the other side, you spend a holdout on a result that was already specified well enough to deserve the test.
That boundary changes the decision a result can support. A strategy can meet a naive Sharpe threshold and still fail once the number of variants tested is taken into account. A feature can look predictive until its timestamp is checked. A model can improve rank correlation and still lose once costs and turnover are factored in.
At that point, the right response is to return to exploration, narrow the claim, or stop. The holdout has already answered the question it was allowed to answer.
That is the practical center of the third-edition workflow.
Three ways into the repo
The new README is the route map for the staged code release. It shows three useful ways to enter the material as the directories fill in.
First, enter by workflow stage. If the problem is data reliability, start with the financial data layer. If the problem is label design, feature triage, or leakage, start with research design and feature engineering. If the problem is model comparison, start with the model chapters. If the backtest looks too clean to believe, start with portfolio construction, costs, risk, and strategy synthesis. If you are working with RAG, knowledge graphs, or agents, start with the advanced-AI chapters. If the issue is live operation, start with deployment, monitoring, and the retrain-pause-retire loop.
Second, enter by case study. The case-study page lists nine studies across seven asset classes, 168 notebooks, and six pipeline stages. Each one puts pressure on a different part of the process:
ETFs are a cleaner daily cross-asset setting for following the full loop.
Crypto perpetuals introduce funding rates, shorter decision intervals, and a market structure that differs sharply from equities.
NASDAQ-100 microstructure makes bar construction, order flow, and intraday costs part of the modeling problem.
S&P 500 equity plus options uses implied-volatility information to improve equity selection.
US firm characteristics revisit the canonical monthly cross-sectional factor problem, where point-in-time data discipline does much of the work.
FX pairs expose the limits of a small cross-section when shared macro and dollar factors are present.
CME futures force rolls, term structure, and sector structure into the foreground.
S&P 500 options test whether an options-only strategy can survive labels, hedging, and instrument-specific costs.
The broad US equities panel asks whether weak individual signals become useful when scaled across thousands of names.
Third, enter by library layer. The current library page lists six workflow-aligned packages: ml4t-data, ml4t-engineer, ml4t-models, ml4t-diagnostic, ml4t-backtest, and ml4t-live. A reader can use a single layer without adopting the entire stack. A data team may only need acquisition and storage. A researcher may only need labels, features, and diagnostics. A course participant may start with a baseline and then decide whether the next change belongs in data, labels, validation, costs, allocation, or execution.
What to inspect first
The first release wave is the data and research foundation. That is less fashionable than agents or deep learning, but it is where many strategy problems start.
The data chapter spans market, fundamental, and alternative data; corporate actions; futures and continuous contracts; options; crypto; FX; point-in-time validation; survivorship; provider comparison; incremental updates; and storage benchmarks.
The microstructure chapter moves from raw exchange messages to feature-ready bars: NASDAQ ITCH parsing, limit-order-book reconstruction, order lifecycle analysis, TAQ-style examples, Lee-Ready validation, alternative bar sampling, and intraday jump detection.
The synthetic-data chapter is another natural deep dive. Since the second edition, the topic has moved well past “can a GAN produce realistic-looking prices?” The current problem is more practical: whether a generator preserves the structure a downstream research task needs, without leaking the original data or creating a world that is easier than the real one. The chapter covers classical simulation, TimeGAN, Tail-GAN, Sig-CWGAN, diffusion-based generators, LLM-based tabular generation, and privacy-aware variants.
If you open the repo as the release unfolds, a reasonable first inspection path is:
pick one case study instead of browsing every notebook;
read the data construction before the model notebook;
locate the label definition, horizon, and decision timestamp;
check the validation split, purge, embargo, and holdout rule;
inspect cost assumptions before performance statistics;
treat the first backtest as a diagnostic, not evidence;
look for the handoff from forecast output to portfolio rule, risk limit, and deployment decision.
That is also the editorial path for the next set of ML4T Insights issues. The useful issues will turn the release into resources readers can keep: a financial-data failure-mode map, a guide to when tick data changes the research problem, an update on synthetic financial data after GANs and diffusion, a case-study access map, and a checklist for when a backtest should count as evidence.
For the first time: live course and workshop
The repo is the public resource. The course and workshop are the guided version of the same workflow. They aim to help you improve your ML4T research and trading practice, not just repeat what’s in the book.
On Wednesday, June 24, there are two free Maven Lightning Lessons:
From trading idea to validated strategy at 16:00 UTC
Build Multi-Agent Systems You Can Audit at 15:00 UTC
The first lesson is the closest companion to this release. It walks through the same transition from idea to baseline, from baseline to diagnosis, and from diagnosis to a cleaner second version without quietly reusing the holdout.
The second lesson connects to the agent material in the later chapters and to the forecasting-agent workshop. It uses the same discipline in a narrower setting: define the task, preserve the trace, compare against a baseline, and score the output.
The full Machine Learning for Trading: From Research to Production course runs July 6 to August 29. It is the live cohort version of the workflow: choose a case-study path, build a baseline, diagnose failure modes, iterate honestly, and defend the result against a published rubric.
The Building Multi-Agent Forecasting Systems workshop runs June 27. It is the hands-on route through the agent side: multi-agent forecasting, trace capture, ablations, and scoring.
Neither course is required to use the public repo. The reason to take one is sequencing, feedback, and time spent applying the workflow with other people.
Start with the map
The practical next step is to watch or star the repo if you want to follow the code release as it unfolds.
The useful test for this release is simple: can a reader open the repo, pick a market, and understand what has to be checked before a model result becomes strategy evidence?