


Jev, TypeSafe’s decision model, identified changes in revenue and earnings per share in company releases more accurately than classifiers trained for these tasks. Jev takes text and questions with predefined answers, then returns an answer and probabilities for the options. Here, it had to decide whether each financial measure had risen from the same quarter a year earlier.
The tests cover earnings releases, company event disclosures filed on Form 8-K, and responses to Securities and Exchange Commission (SEC) comment letters. For the event disclosures, Jev had to choose the filing category. For the letters, it had to predict whether SEC staff would issue further comments after the company’s response.
The classifiers learned from filings paired with the answers for each task. Those answers came from reported financial figures, the company’s chosen filing category, or subsequent staff correspondence. Jev received the text and questions without task-specific training examples.
Jev identified revenue changes with 98.5% accuracy and earnings-per-share changes with 99.0%. No trained classifier in these tests passed 73% or 64%, respectively. Trained classifiers were more accurate at assigning filing categories and predicting further SEC comments. Adding information about investment-company filings improved Jev’s SEC forecasts, but the trained text models still led.
Disclosure: TypeSafe provided API access for this unpaid evaluation and suggested the domain-information addition tested below.
Jev identified earnings changes more accurately than trained classifiers
For the earnings test, each model received a 2023 filing. It had to decide whether total revenue and diluted earnings per share under US generally accepted accounting principles (GAAP) rose from the same quarter a year earlier, and whether the company reported a net loss. The questions specified the requested figures and comparison period.
NVIDIA’s first-quarter fiscal 2024 release, filed May 24, 2023, illustrates the task. Its opening headline reports quarterly revenue up 19%. Revenue was $7.19 billion, compared with $8.29 billion a year earlier. The headline compares with the previous quarter. Year-on-year revenue fell 13%.
GAAP diluted EPS rose from $0.64 to $0.82, while adjusted EPS fell 20%. The release shows both growth and decline. Correct answers require the GAAP figures and the year-on-year comparison specified in the questions.
Jev answered revenue down, GAAP EPS up, and no net loss, assigning probabilities of 0.95, 0.98, and 0.97 to those answers. One fine-tuned text model, ModernBERT, got EPS right but predicted revenue growth and a net loss. SEC-BERT got EPS and net loss right but also predicted revenue growth.
The reference answers came from financial figures tagged in each company’s quarterly or annual report. Comparing the current and prior-year figures supplied both the training labels and the answers used for scoring. We trained and tested the classifiers on separate groups of companies.
Some releases omit the figures needed for the comparison. The headline results cover 802 revenue and 833 EPS comparisons for which both report numbers were found in the release text. This retrospective check uses reports that can arrive after the release and matches number strings without verifying their meaning. It cannot serve as an automatic eligibility test when new releases arrive.
On those selected releases, Jev scored 98.5% for revenue and 99.0% for EPS. The strongest trained classifier, TF-IDF with LightGBM, reached 72.6% and 63.6%. Always choosing the more common answer would score 56.6% and 51.1%, so class imbalance does not explain the earnings result. TF-IDF represents words and word pairs as weighted counts; LightGBM fits decision trees to that representation.
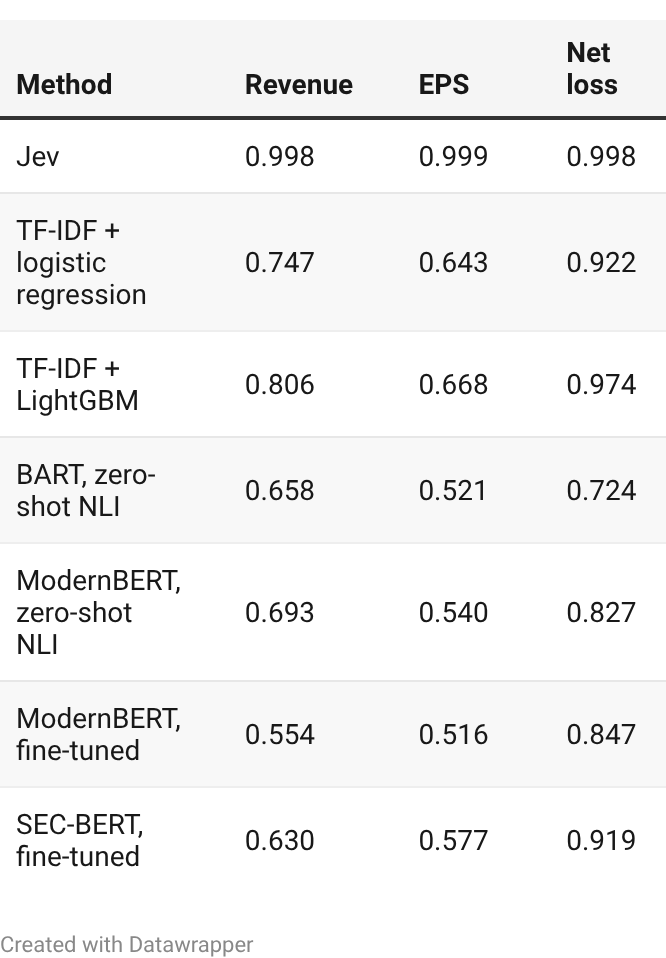
AUC measures how well the probabilities rank positive answers above negative ones across cutoffs. Jev scored 0.998 for revenue and 0.999 for EPS, compared with LightGBM’s 0.806 and 0.668. All methods’ AUCs appear in the appendix.
Without the number check, Jev’s accuracy was 95.4% on 887 revenue comparisons and 94.9% on 948 EPS comparisons. It scored 97.3% on 1,044 net-loss observations, which had no equivalent check.
Jev received the full release, while the fine-tuned text models received roughly the first 4,000 tokens. Those models were trained as document classifiers with untuned settings. The test did not include a system that extracts and compares the requested figures.
The tested questions offered only yes/no answers, so Jev had to choose even when a release omitted the requested comparison. A research system using these questions would need to handle unavailable comparisons separately.
Trained classifiers assigned 8-K categories more accurately than Jev
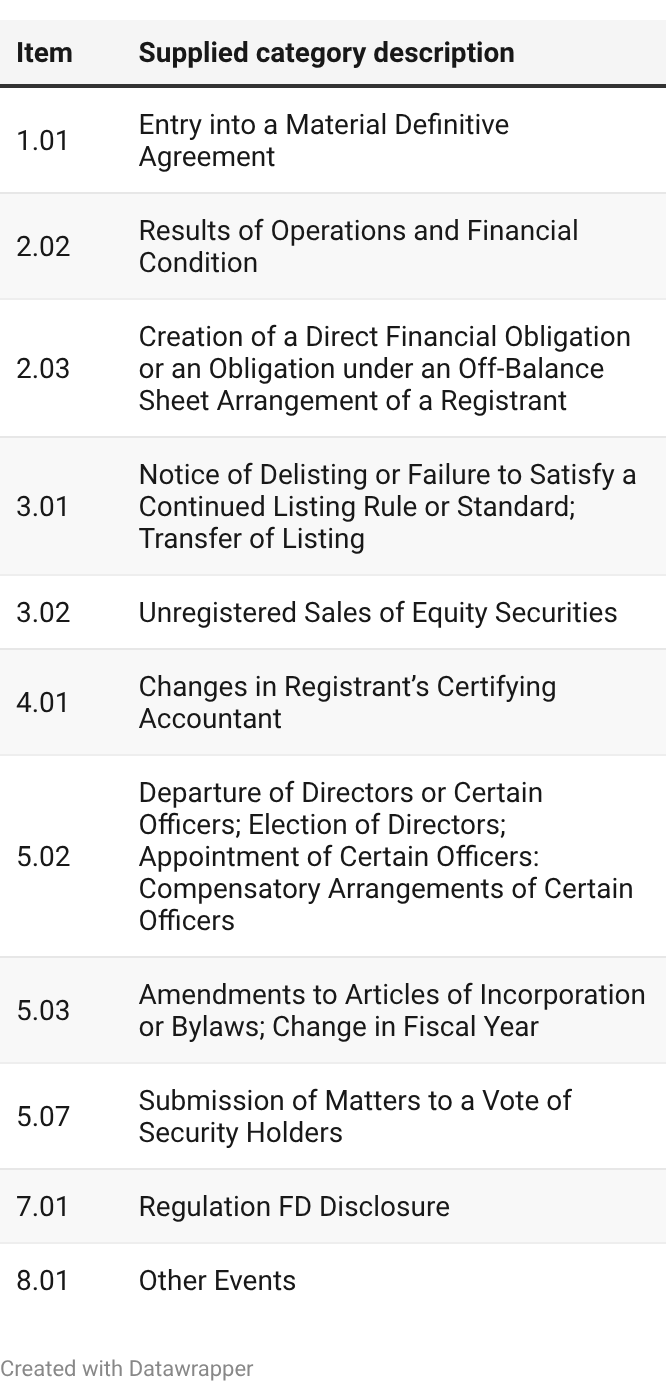
Form 8-K gives companies numbered categories for reporting significant events. Each model had to identify the category the company selected when submitting its filing to the SEC. The test covers January-September 2023 filings with one substantive item, in eleven categories. Models received the narrative and relevant exhibits after removing item numbers and category headings.
Tesla’s August 7, 2023 filing reports that Vaibhav Taneja became CFO after Zachary Kirkhorn stepped down. The answer key is Item 5.02, the category for specified director and officer changes. Jev selected it under three question wordings, with probabilities of 0.97-0.99. Both fine-tuned encoders selected it too.
Across 3,006 usable filings, Jev scored 79.3%. TF-IDF with logistic regression reached 89.4%; LightGBM reached 91.3%. The fine-tuned encoders scored about 88%. Training on public labels was more effective at reproducing the filer’s category across these eleven categories.
Jev’s errors concentrate in Item 7.01 (Regulation FD disclosure) and Item 8.01 (other events). Form 8-K’s instructions permit Regulation FD information under either item, with different furnished/filed treatment. Reproducing the company’s choice requires distinguishing categories that can describe the same event. Trained classifiers may learn drafting cues such as furnished/filed language; these runs did not isolate the cues responsible for their advantage.
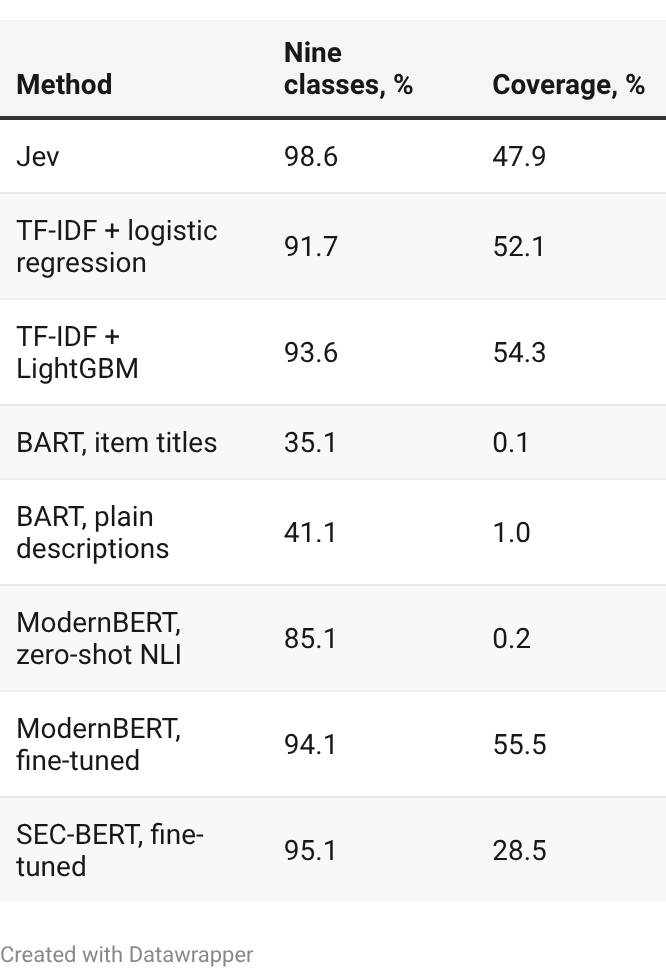
On the other nine categories, Jev was correct on 98.6% of 1,876 filings, ahead of the strongest trained baseline’s 95.1%. On the 1,130 Item 7.01/8.01 filings, Jev scored 47.3%, versus 77.6% for fine-tuned ModernBERT and 75.5% for SEC-BERT. We selected that split after examining errors and using the true category. A researcher cannot achieve that result by filtering on Jev’s prediction. When Jev predicted one of the nine categories in this mixed feed, it was right 83.1% of the time.
A system could use answer probabilities to reserve uncertain category assignments for manual review. Retaining only the most confident predictions gave Jev 47.9% coverage of the evaluated filings at 99% observed precision; fine-tuned ModernBERT covered 55.5%. The cutoffs were chosen after the outcomes were known, so a live system would need to validate them on new filings.
Trained classifiers predicted further SEC comments more accurately than Jev
SEC staff use comment letters to ask companies to clarify their filings or add disclosure. In this test, Jev and the classifiers had to predict whether the staff would issue further comments after a company responded.
Teladoc’s February 3, 2022 response answers a request to explain a 15.7-year useful life for acquired customer relationships. Teladoc committed to expanding disclosure in its next annual report. The staff closed the review on February 8.
Whether the response fully resolves every issue on its face differs from whether the staff will issue another comment. The closing outcome requires forecasting the staff’s next action. A response can satisfy that process by committing to future disclosure.
On Teladoc, Jev assigned a 0.42 probability to further comments when asked directly about that outcome. Asking whether the staff would be satisfied and close the review implied 0.43. Asking whether the response fully resolved every comment implied 0.76. Fine-tuned ModernBERT and SEC-BERT predicted 0.24 and 0.01, respectively. The observed outcome was no further comments.
The broader test used 2,261 distinct response letters from 2022-2023. The outcome labels mark 925 (40.9%) as drawing substantive further comments within 90 days. A letter closing the review counts as no further comments. The forecast concerns another round of substantive questions within that window, rather than eventual resolution of the filing review.
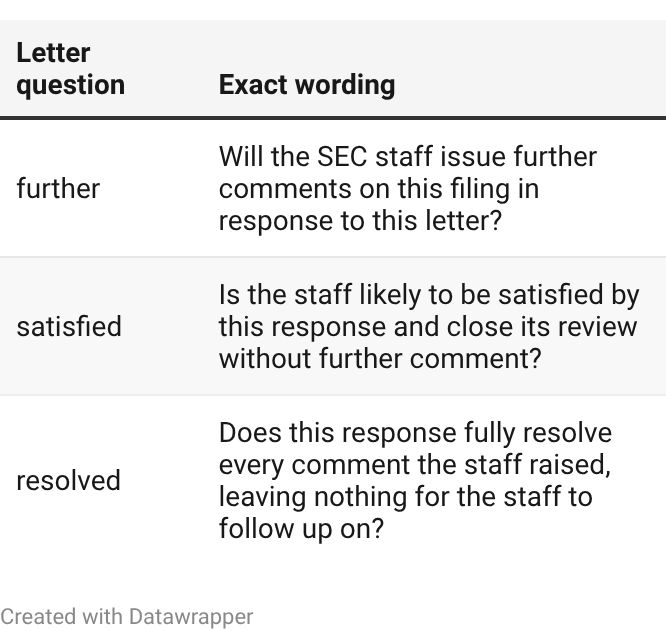
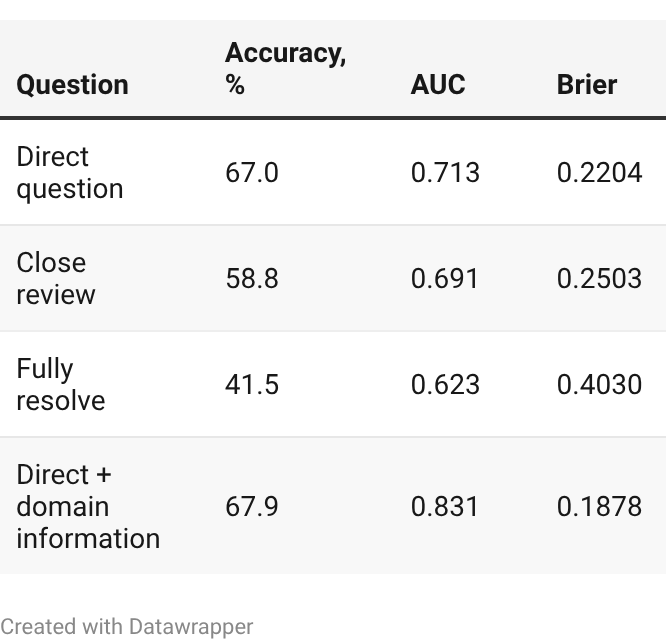
Jev’s accuracy was 67.0% under the direct “further comments” question, 58.8% under “satisfied” and 41.5% under “fully resolves every comment”. The full-resolution question asks for a more demanding judgment about the response than the future staff action used for scoring.
Always predicting no further comments would score 59.1% accuracy, since that was the more common outcome. AUC measures how well the probabilities rank letters that drew further comments above those that did not. Brier score measures squared probability error, with lower values better. A model can rank the letters correctly while assigning probabilities that overstate the risk of further comments.
The direct Jev question scored AUC 0.713 and Brier 0.2204. Fine-tuned ModernBERT reached 80.6% accuracy, AUC 0.890, and Brier 0.1346. Every trained text classifier beat the direct Jev question on all three metrics.
A hint about investment-company filings improved Jev’s SEC forecasts
Following TypeSafe’s suggestion, we added a new question that stated investment-company filings rarely draw another round of comments. We added it after examining the initial results and testing it on the same letters. Its improvement therefore needs confirmation on new letters.
Jev’s accuracy rose to 67.9%, AUC to 0.831, and Brier improved to 0.1878. The probability improvement was concentrated in investment-company filings. Predictions also changed outside that group, worsening probability error for S-4 and F-4 responses, where further comments were common.
The augmented question ranked outcomes better than the simple form-plus-length comparator, whose AUC was 0.814. That comparator had a lower Brier score of 0.1711. All trained text classifiers beat the augmented Jev question on accuracy, AUC, and Brier.
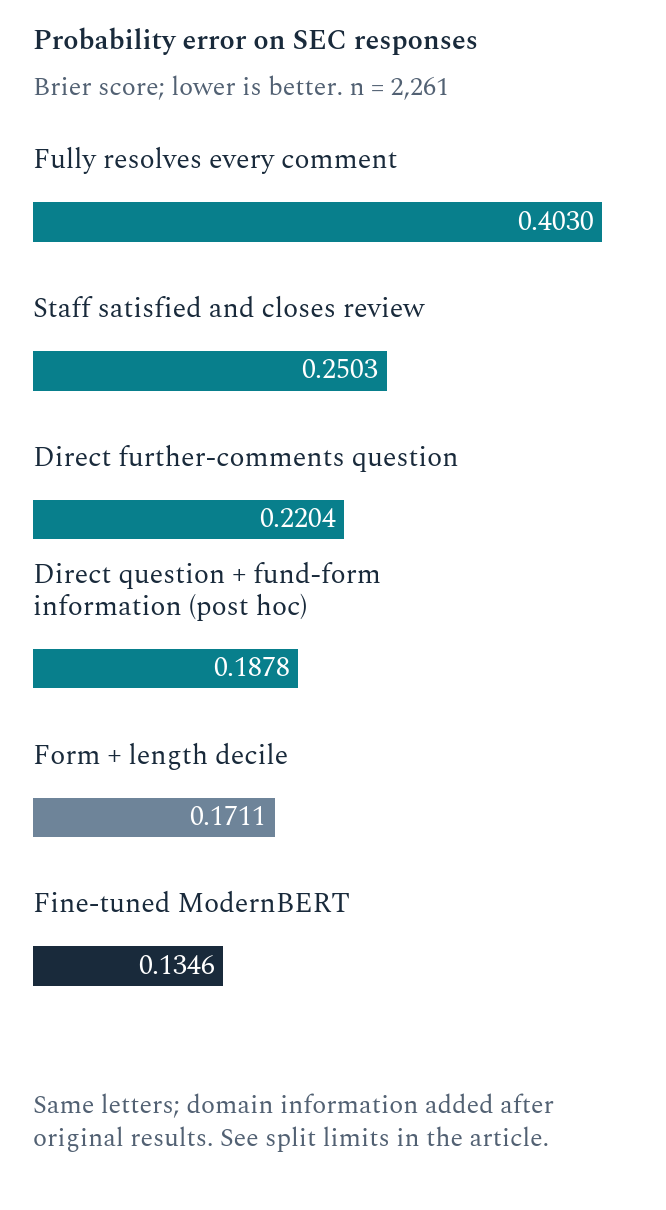
Comment-letter Brier scores. The direct outcome question improves on the full-resolution question; post hoc domain information improves it further. The trained ModernBERT row still has the lowest error. Lower is better; all rows use 2,261 letters.
Full results for earnings changes, filing categories, and SEC follow-up
The tables use the same Jev-answered documents within each task. Revenue, EPS, and loss have different denominators and checking rules. ModernBERT and SEC-BERT are text encoders; we fine-tune them on the task’s labeled documents. The two zero-shot natural-language-inference (NLI) models instead score candidate answers as hypotheses against the text.
Earnings accuracy (%)
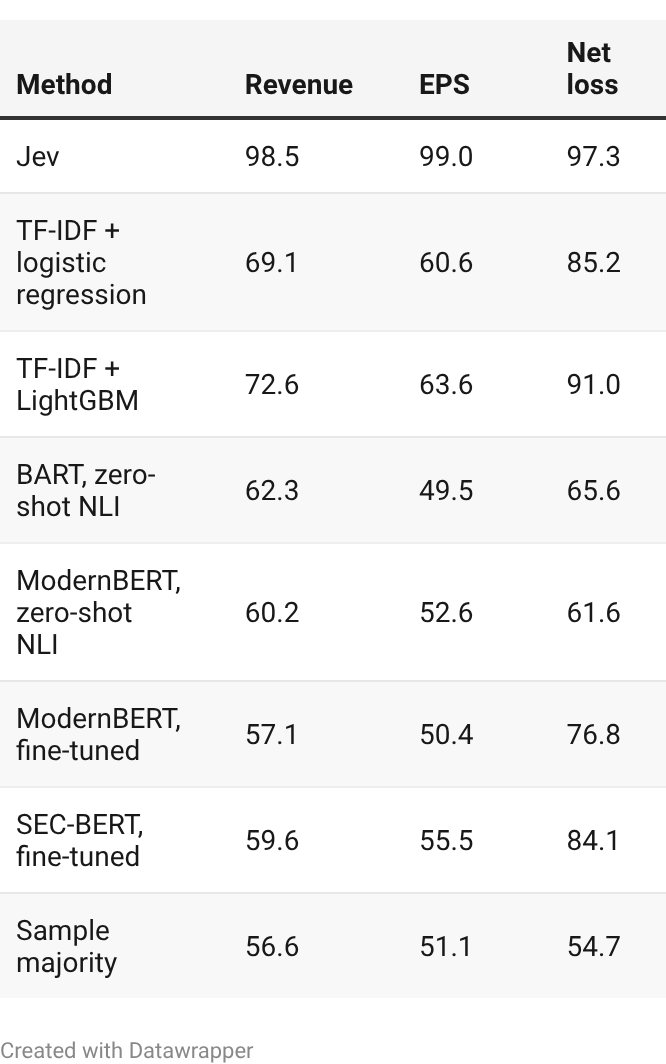
Revenue n = 802; EPS n = 833; net loss n = 1,044. Only revenue and EPS use the number check.
Filing-category accuracy (%)
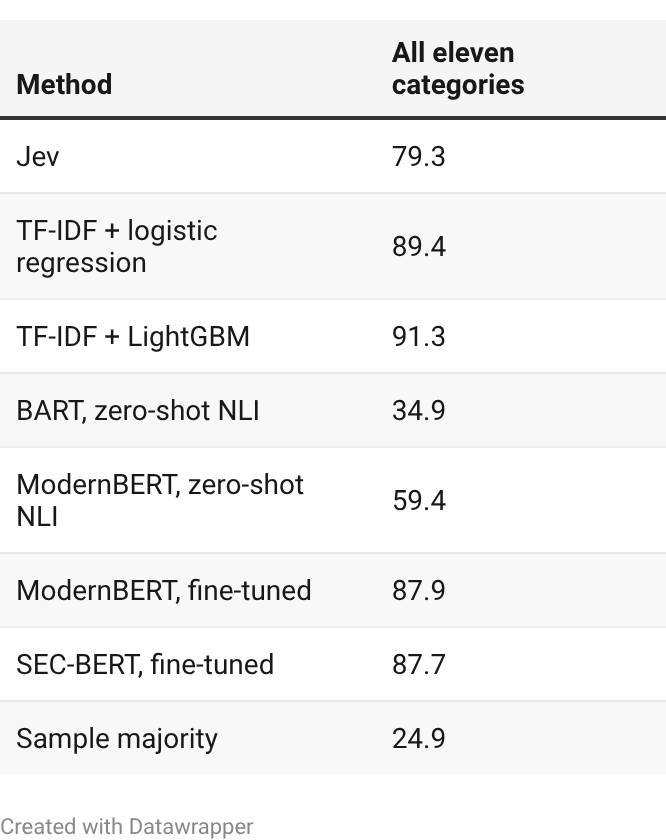
n = 3,006. Jev averages three question wordings. BART uses plain category descriptions; formal item-title hypotheses scored 26.8%.
Further SEC comments: accuracy and probability error
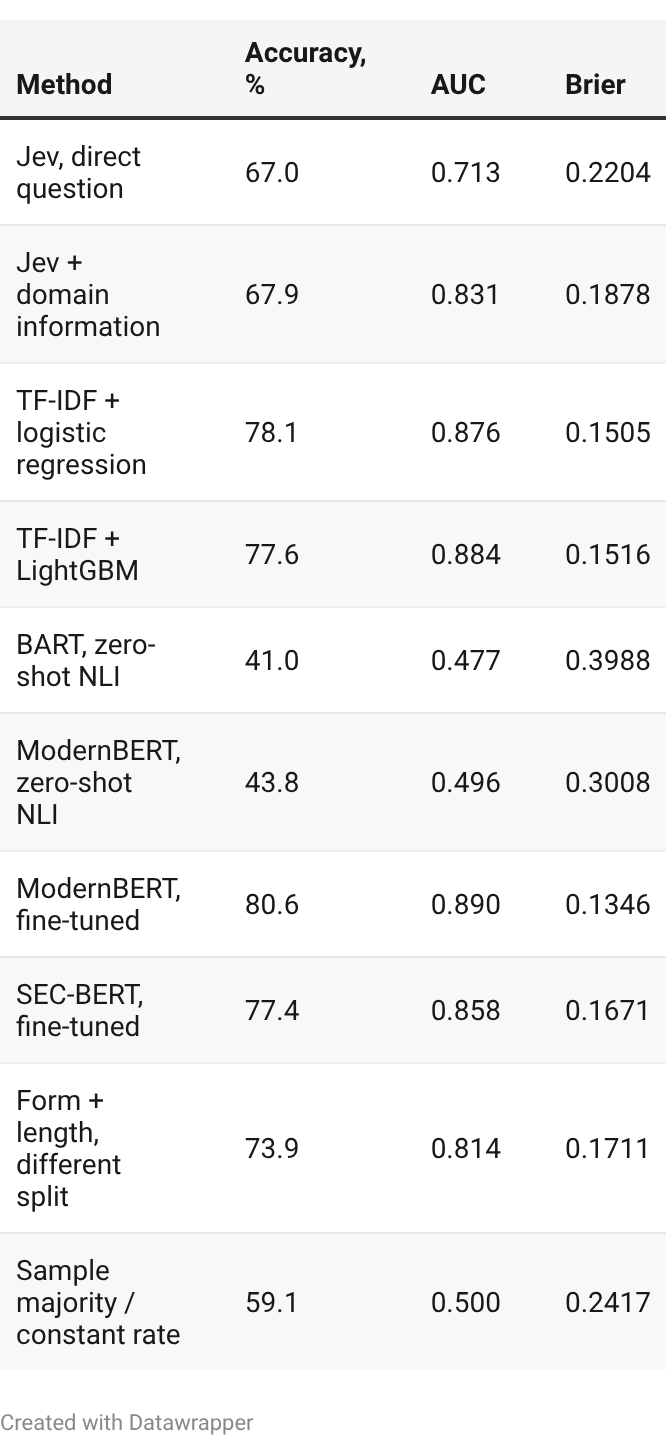
n = 2,261. Higher AUC and lower Brier are better. We chose to add domain information after examining the results. The form-plus-length comparator uses a different split. Sample majority and constant-rate predictions use evaluated outcomes as diagnostics, rather than prospective forecasts.
Company grouping keeps test labels out of training, with qualifications detailed in the appendix: TF-IDF uses test text when building its vocabulary, and some letters share co-registrant companies across the split.
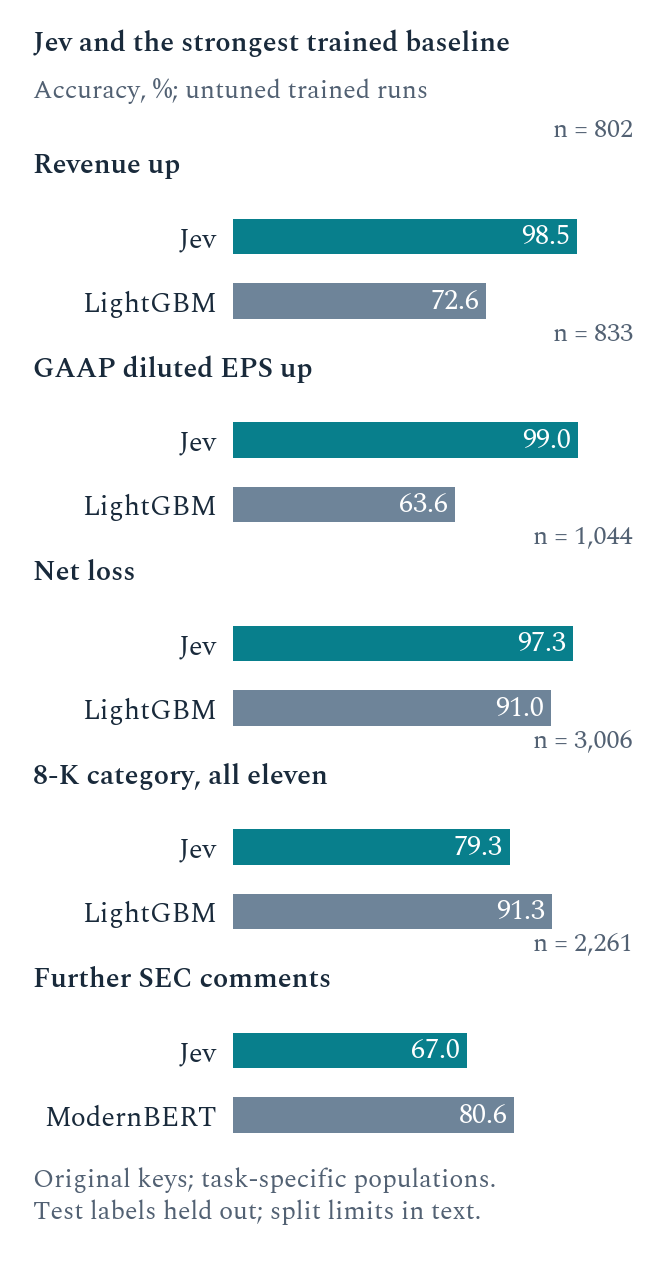
Jev leads the tested classifiers on earnings; the strongest trained baseline leads across all eleven evaluated 8-K categories and on further SEC comments. Task-specific denominators and validation limits apply.
Classifiers beat Jev on 8-K categories with 400-1,600 training filings
Jev’s category assignments require no task-specific training set. To measure how much supervision would beat them, we trained the classifiers on increasing numbers of labeled filings, excluding the tested companies. Each point averages two fixed evaluation halves, without uncertainty estimates, so the crossing ranges are approximate training budgets.
Across the eleven evaluated 8-K categories, logistic regression and SEC-BERT were below Jev at 400 labeled training documents and above it at 800. ModernBERT crossed between 800 and 1,600. At 1,600, logistic regression and ModernBERT also exceeded Jev’s evaluated-feed reference coverage of 47.9% at empirical 99% precision. SEC-BERT did not.
For comment letters, logistic regression and SEC-BERT exceeded the original Jev question at the smallest tested size, 200 letters. ModernBERT crossed between 200 and 800.
None reached Jev on earnings at the tested 100, 200, or 400 releases drawn. The earnings pools include unlabeled releases, so a 400-release draw supplies only 198-220 revenue labels. These curves compare against Jev’s 95.4% revenue accuracy before the number check.
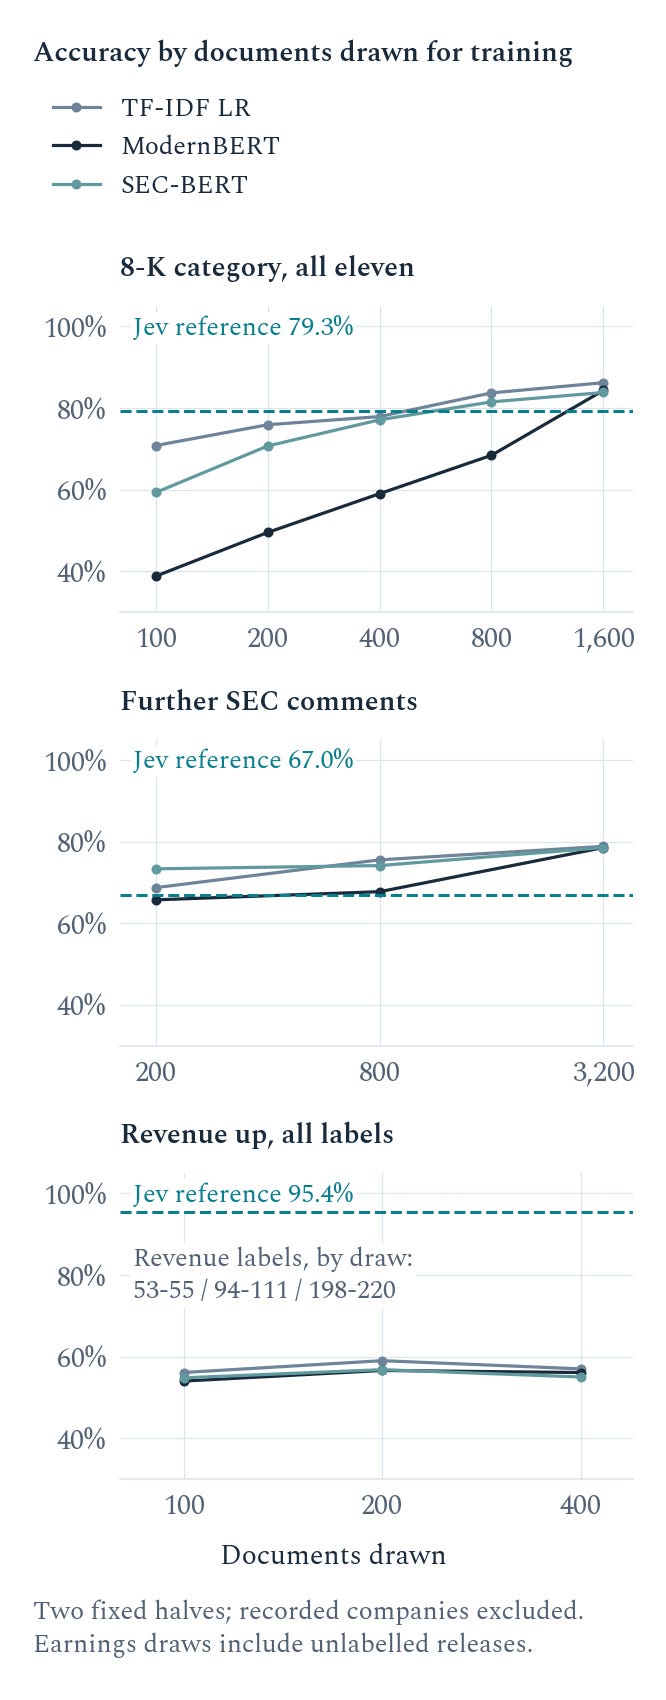
Fixed company-excluding learning curves. Earnings counts are drawn from documents, including unlabeled releases, and use unfiltered revenue accuracy. Appendix tables give effective label counts. No uncertainty bands or LightGBM curve were produced.
Jev did not produce useful merger forecasts from contract terms alone
A separate experiment asked Jev whether a merger would complete, using the contract’s closing conditions. On 3,106 resolved deals, its AUC was 0.504, close to chance ranking. Forecasts from structured deal summaries depended heavily on the market-implied probability supplied alongside them. The inputs omitted news, regulatory developments, and financing research. The appendix gives the separate and paired sample results.
Earnings decisions were Jev’s strongest financial result
For a researcher extracting earnings-direction features, Jev produced more accurate answers than the tested classifiers without requiring task-specific training examples. NVIDIA’s release illustrates what that decision entails: selecting the requested metric and comparison period among several reported measures.
For reproducing SEC filing categories or predicting further staff comments, labeled examples gave the trained models an advantage. The category learning curves put the cost of matching Jev at roughly 400-1,600 labeled filings, depending on the classifier. The earnings result therefore does not settle the choice for every financial-text task.
These tests compare Jev with document classifiers, including two language models used for zero-shot classification. They do not compare it with other generative language or decision models, and it is unclear how much exposure to historical filings it received during pretraining.
Methods appendix
Which filings were used and how their scoring labels were constructed
Earnings. Start with 2023 Item 2.02 filings and extract the primary narrative plus EX-99 exhibits. The available sample contains 1,391 release bodies. Match each to the earliest qualifying 10-Q/10-K filed from ten days before to 100 days after the release, carrying an 80-100-day quarter ending no more than 100 days earlier. Use US-GAAP XBRL revenue, EPS, and net-income facts from that report and the corresponding prior-year quarter. The matching/tag-precedence rules can select a minor line or the wrong EPS basis. Equal comparison figures, zero net income, and absent facts produce missing labels. XBRL labels are later evidence for scoring, not inputs available to the model at release time.
Of 1,391 releases, 328 have no qualifying report match. Of 1,063 matches, two supply no nonmissing task label, leaving 1,061 releases submitted to Jev; five failed the service’s token limit. The 1,056 usable releases yield 887 revenue labels, 948 EPS labels and 1,044 loss labels. The number check retains 802 revenue and 833 EPS cases. It checks magnitude strings, not table meaning or signs, and the audit found false matches. The 20 audited discrepancies cover revenue/EPS only; no complete corrected key exists. The matching rule selects discrete quarterly facts; performance on unmatched releases and other reporting structures is unknown.
The source’s audit of the 20 remaining revenue/EPS disagreements attributed thirteen to scoring-label errors, four to metric definitions and three to unavailable comparisons. Ten labels used a minor revenue line: nine bank fee lines and one other-revenue line. Another bank case depended on gross revenue versus net interest income plus noninterest income. Three EPS labels lost a loss’s minus sign; three used total EPS where the release headlined continuing-operations EPS. The three unavailable comparisons passed the number check, and Jev’s answer probabilities were 0.57-0.74.
The source audit found no clear wrong Jev answer based on the requested figures in the release. The reported scores nevertheless retain the original labels. We did not compute a complete corrected-label score, and we did not audit agreement cases; the disagreement audit does not establish 100% accuracy.
Majority-class accuracy on the displayed revenue/EPS/loss populations is 56.6% / 51.1% / 54.7%.
8-K. The original random sample of 6,000 entries from EDGAR’s 2023 Form 8-K quarterly indexes yielded 5,704 retained rows, 4,049 single substantive-item reports, and 3,976 rows in eleven classes with at least 30 members. Accession deduplication leaves 3,967 eligible documents in the current training loader. Remove official item numbers/titles and section headings, check for surviving headings, and include EX-99 exhibits. The reported result covers 3,006 usable documents from 3,011 requests; five documents failed, producing fifteen unusable question rows. The budget-limited run processed date-ordered filings from January 3 through September 27, 2023. It excludes multiple substantive items and rare/unlisted categories. The nine-category analysis is a post hoc split by true label.
Letters. Sequence 2022-2023 UPLOAD and CORRESP filings by company. Decode staff letters and classify their content; an UPLOAD closing the review is not a positive outcome. A response is positive if substantive further comments occur within 90 days. Closing letters, silence, and unrelated declinations count as negative. Unreadable or unclassified follow-ups and responses without a full observation window are excluded. The last labeled response date is September 29, 2023. Company-level sequencing can link concurrent reviews, and not all regex classifications have been manually adjudicated.
The corpus contains 18,419 rows and 16,428 distinct readable accessions, with 287 accessions repeated for co-registrants. Restrict to responses between 3,000 and 90,000 characters and take an evenly spaced 2,500-row sample. It resolves to 2,261 unique letters, with 925 positives and no unusable answers. Duplicated answer accessions are pooled by wording. Their stored labels agree in the available outputs. The training loader keeps the first CIK per unique letter and the labels carried by answered rows.
Exact questions and answer options
These are the exact tested Jev instructions. Each earnings question has a true/false answer, with the criteria stated below. The three filing-category questions use the same eleven numbered options. None of the letter questions specify the 90-day scoring horizon.
Revenue up
Is the company’s total revenue for the most recent fiscal quarter reported here higher than its total revenue for the same quarter of the prior year?
True: Revenue for the latest quarter is higher than a year earlier. False: Revenue for the latest quarter is lower than a year earlier.
GAAP diluted EPS up
Is the company’s diluted earnings per share under GAAP for the most recent fiscal quarter reported here higher than for the same quarter of the prior year?
True: GAAP diluted EPS for the latest quarter is higher than a year earlier (a smaller loss per share counts as higher). False: GAAP diluted EPS for the latest quarter is lower than a year earlier.
GAAP net loss
Did the company report a GAAP net loss for the most recent fiscal quarter reported here?
True: The latest quarter’s GAAP net result is a loss. False: The latest quarter’s GAAP net result is a profit.
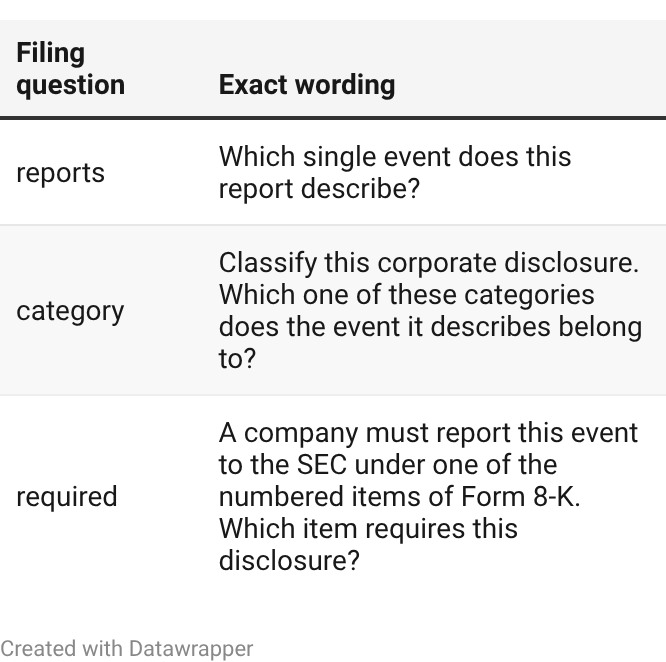
The post hoc domain run appends this exact text to the direct further-comments question:
Background: when the filing under review is an investment-company form (N-1A, N-2, N-CSR, N-14, N-4, N-CEN), the staff almost never issues a further round of comments.
The added statement is an intervention based on this sample, not an independently validated general fact about the SEC.
Which models were tested, what text they received, and how they were trained
Jev receives full supplied text and typed questions without labeled examples. All measured runs are recorded as jev-1.13.0, September 21-October 7, 2026. Original compact task files lack version fields; the experiment record and October 7 sampled recheck supply the attribution. Of 591 earnings and 456 event answers compared in that recheck, 2 and 5 changed. This sampled agreement does not establish identical responses on the entire corpus.
BART is facebook/bart-large-mnli; zero-shot ModernBERT is MoritzLaurer/ModernBERT-large-zeroshot-v2.0. Candidate answers are hypotheses. Consecutive text windows reserve space for hypotheses within nominal contexts of 1,024 and 8,192 tokens. For each hypothesis, take its maximum entailment logit across the full document’s windows, then softmax over the alternatives. Thus, the two answer hypotheses can obtain their strongest evidence from different windows. BART item-title and plain-description variants are reported separately.
TF-IDF uses words/word pairs, sublinear term frequency, document-frequency limits of 2 and 0.9, and at most 50,000 features. Logistic regression uses C = 10 and at most 2,000 iterations. LightGBM uses 400 trees, learning rate 0.05, 31 leaves, minimum child size 10, and column fraction 0.3. We did not tune these settings for this article. Vocabulary and IDF are fitted before splitting, on the whole task corpus. Only classifier labels are held out.
The fine-tuned general encoder is answerdotai/ModernBERT-large; the finance encoder is SEC-BERT, pretrained on 260,773 10-Ks from 1993-2019. ModernBERT uses two epochs, a learning rate of 2e-5, and a batch size of 2 with eight-step accumulation, for an effective batch of 16. SEC-BERT uses three epochs, a learning rate of 3e-5, and a batch size of 16. Both use weight decay 0.01, a linear schedule, and 10% warm-up. The runs used one RTX 3090.
ModernBERT uses a single nominal 4,096-token window, including special tokens. SEC-BERT processes up to eight 512-token windows, then averages probabilities. Content limits are 4,094 and 4,080 tokens, respectively, using different tokenizers; later text is dropped. Each SEC-BERT window inherits the document label, which may depend on information elsewhere. Earnings models have three outputs and mask missing labels. The limited training and window averaging are consequential design choices, not optimality claims. A one-fold ModernBERT check using five epochs and learning rate 5e-5 did not improve revenue accuracy; it was not a full tuning search.
How companies were separated between training and testing
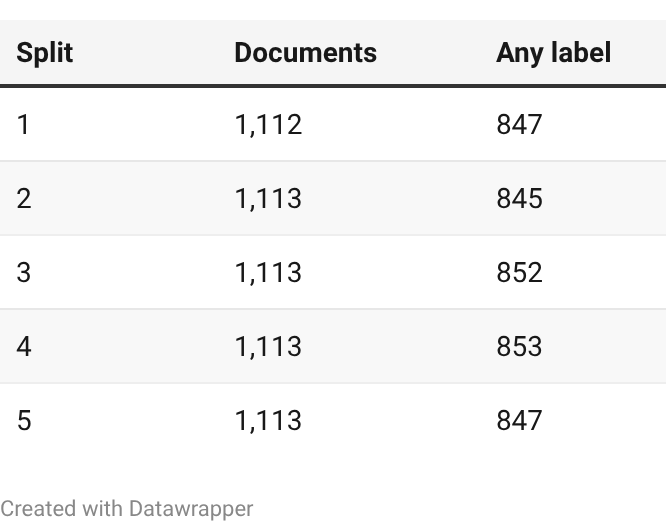
For earnings and filing categories, companies are divided into five groups. Each classifier trains on four groups and is tested on the fifth, repeating until each group has been tested. This is GroupKFold splitting by CIK, the SEC’s company identifier. The earnings pool includes all 1,391 bodies: 330 have no task label, comprising 328 unmatched releases and the two matched but unlabeled releases. TF-IDF fitting masks missing labels separately for each question; the encoders mask missing output targets. Documents drawn therefore overstate supervision. The tables show the training counts for each split. Splits 1-5 correspond to stored fold IDs 0-4. Every 8-K training document is labeled, with 3,173-3,174 per fold.
Earnings training documents
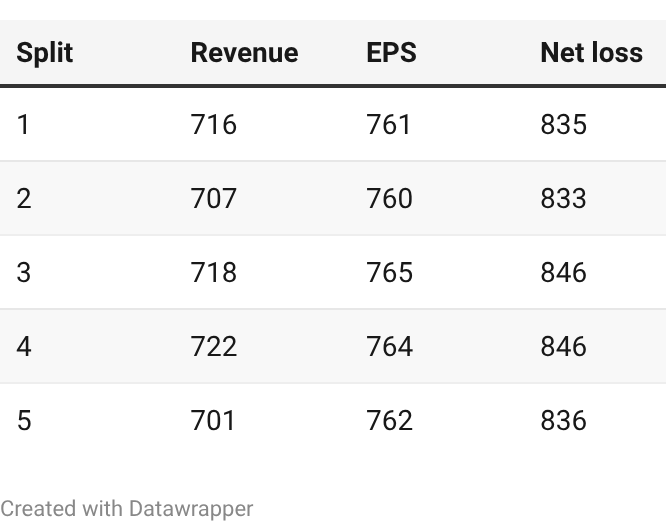
Earnings training labels by question
Letter text models train on 8,875 unique letters outside the test letters’ first-recorded CIKs. A local audit confirms disjoint recorded CIK sets. Checking all co-registrant associations instead finds 86 letter-company IDs on both sides. These are nominal company-grouped tests, with residual issuer-association overlap for letters and full-corpus TF-IDF preprocessing.
The form-plus-length baseline instead excludes evaluated accessions and estimates outcome rates by subject form and length decile, using a minimum cell size of 20 and form/overall fallbacks. It trains on 14,961 corpus rows, retains co-registrant repetition and shares 1,727 company IDs with the evaluated letters. Its result is a simpler comparator with a different split, not an equally isolated-company model.
Learning curves randomly divide answered documents into two evaluation halves with seed zero. For each half, draw training documents from the other half plus unanswered documents, excluding evaluated recorded CIKs. Points are unweighted means of the two half scores; no repeated-seed uncertainty was measured. Earnings scores use all nonmissing labels, before the number check. We skipped the 800-document earnings draws because only 780 and 777 eligible documents remained. No grouped LightGBM curve was produced.
The eligible earnings pool ranges from 777 to 780 documents. Separate full-data folds draw 1,112-1,113 documents, with 845-853 carrying any label and 701-722 carrying revenue labels. The 400-document curve draws supply 198-220 revenue labels and uses Jev’s unfiltered 95.4% revenue reference, rather than the selected-release 98.5%. For comment letters, the 200-letter logistic-regression margin over Jev was 1.7 accuracy points.
The curve tables use “Logistic” for logistic regression. Training n counts documents used for fitting; earnings draw n also includes documents without labels.
Filing-category learning curve: accuracy (%)
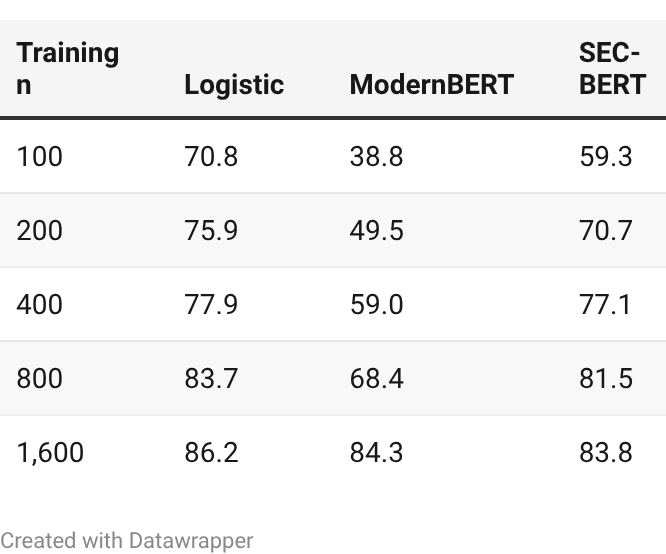
Comment-letter learning curve: accuracy (%)

We did not test the 3,200-document filing point or the 100-, 400-, and 1,600-letter points. ModernBERT and SEC-BERT are fine-tuned in all learning curves.
Earnings learning curves: accuracy (%)
Revenue:

EPS:

Net loss:

Effective supervision in the earnings curves
Each point averages two separate tests, groups A and B (stored half IDs 0 and 1). Documents without the required answer do not train that question.
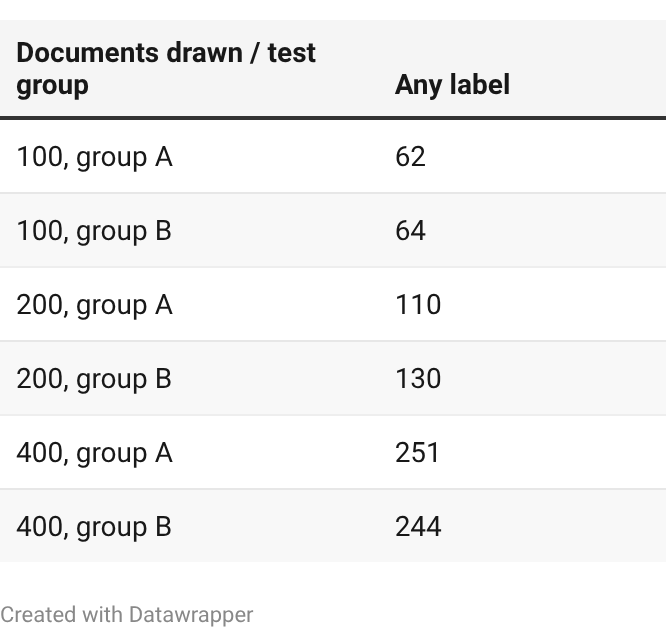
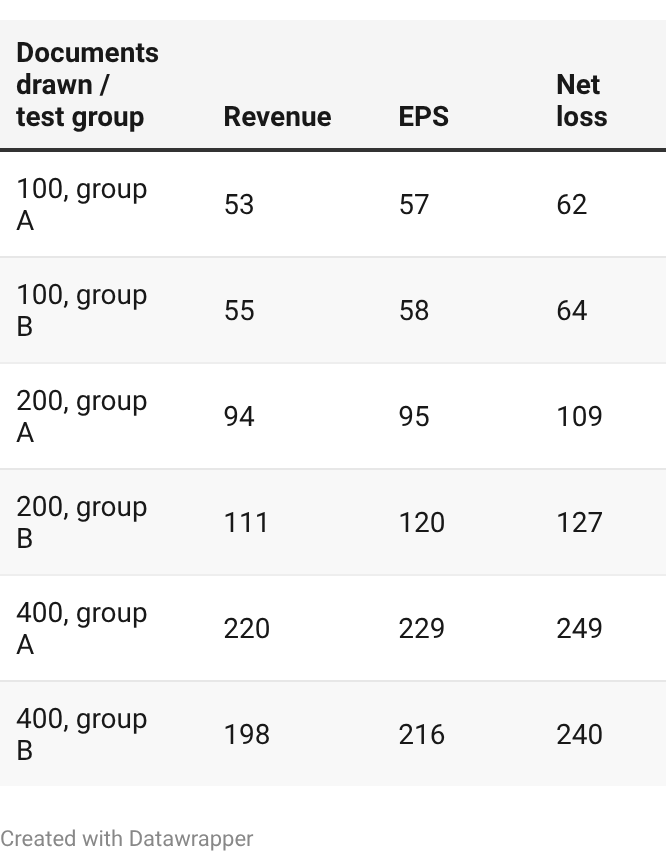
Curve sizes count documents drawn; only nonmissing earnings labels provide supervision. Full-data fits and curve points are separate experiments. Historical company grouping is not a forward time split. Neither company-size strata nor this design rules out prior exposure to the public filings. No after-training-cutoff test was performed.
How well the earnings probabilities ranked positive and negative answers
These scores use the main accuracy table’s populations: selected revenue and EPS releases, and all labeled net-loss observations. AUCs for Jev and the language-model baselines were recomputed from retained probabilities, with half credit for ties. TF-IDF AUCs come from the saved score table; its per-document predictions were not retained. The constant-score reference has AUC 0.500.
How probabilities were scored and answers selected for high precision
Binary decisions use P(yes) at 0.5; multiclass decisions choose the largest probability. Letter questions phrased positively about resolution are complemented into P(further comments). AUC gives tied probabilities half credit. A strictly increasing recalibration preserves ranking, though mappings that create ties can alter AUC. Brier measures probability error and does not alone establish calibration.
Effect of the letter question
Short row names refer to the exact questions above.
Probability error outside investment-company forms
The full-sample letter accuracy, AUC, and Brier scores are in the main results table. This table adds the Brier scores after excluding fund forms.
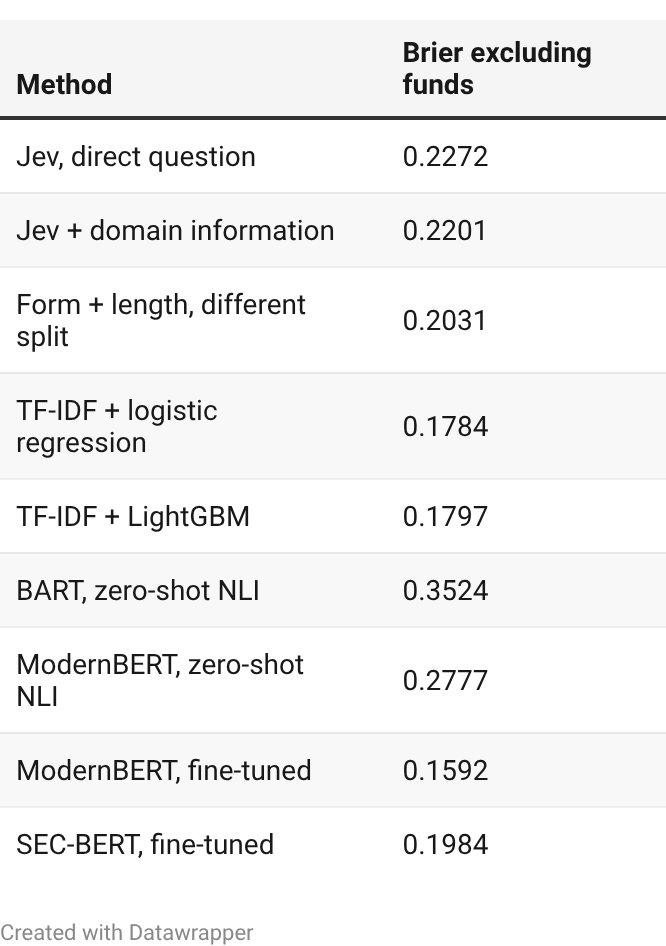
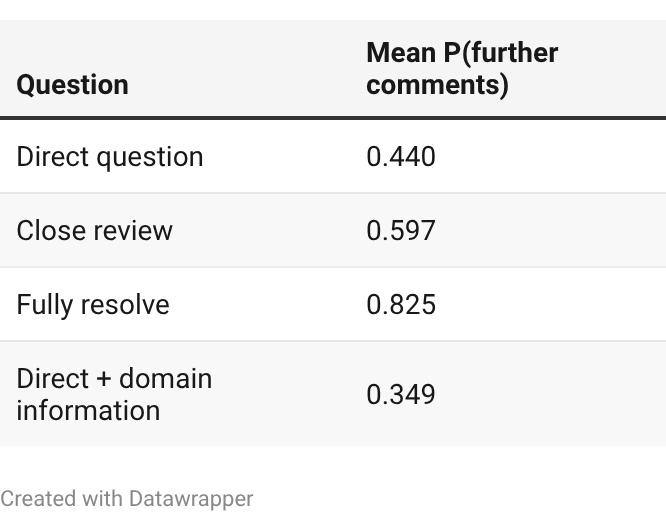
The three original letter questions imply mean probabilities of further comments of 0.44, 0.60, and 0.82. Adding domain information lowers the overall mean of the direct question from 0.44 to 0.35. The four sizeable fund-form groups’ Brier ranges change from 0.1003-0.2132 to 0.0131-0.0356, or roughly 0.10-0.21 to 0.013-0.036. For S-4 responses, Brier worsens from 0.2391 to 0.2631; for F-4, from 0.2624 to 0.2923. The pooled improvement from 0.2204 to 0.1878 closes 66% of the gap to the form-plus-length comparator’s 0.1711, while leaving the trained text models ahead.
Brier includes both reliability and resolution effects; a lower Brier score alone does not prove calibration. Pooled results combine different filing-form populations. After examining the original results, we selected the domain-information run and nine-category event analysis.
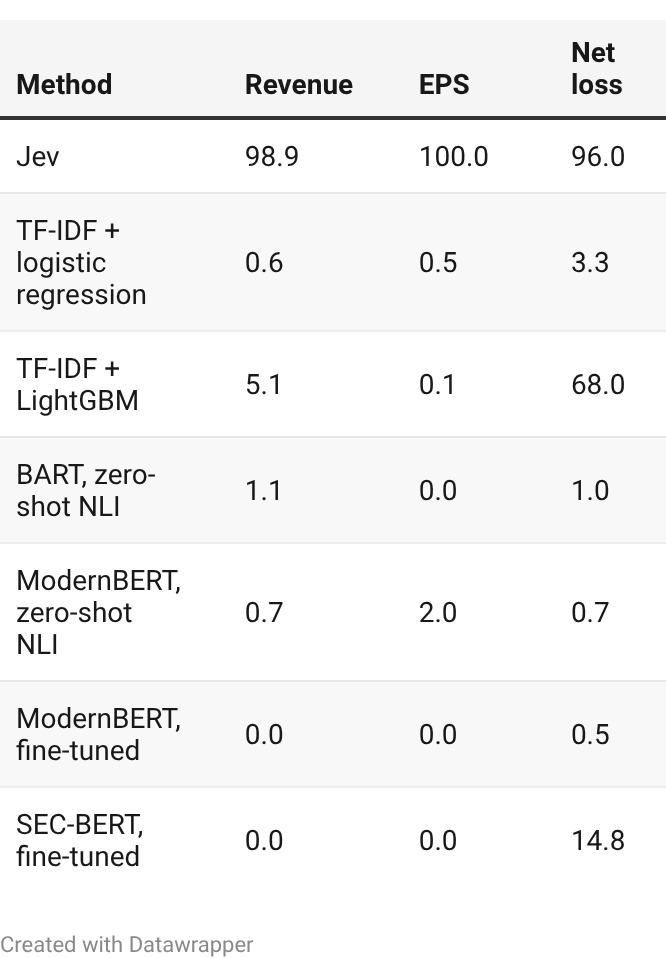
For coverage, rank the top answer probability for all methods, accept whole ties together, and select the widest evaluated set at or above 99% observed precision. Jev’s separately documented confidence output was not retained in these compact task files. All submitted usable documents receive answers; this metric adds selective acceptance afterward. It is neither class recall nor a prospectively fixed operating threshold. The tables below retain original keys.
Earnings coverage at 99% observed precision (%)
The nine-class accuracy uses filings whose true item is outside 7.01/8.01. Coverage uses all 3,006 filings at 99% observed precision.
Original-key scores do not resolve label ambiguities, omitted comparisons, or missing inputs observed in the data. The evidence supports method comparisons on the selected historical documents. It does not measure live research acceptance, probability portability, or investment returns.
Merger samples and the effect of including market probabilities
The raw closing-conditions run includes 3,106 resolved deals announced in 2005-2026, with 234 breaks (7.5%). AUC is 0.504, and Brier is 0.2151, versus 0.0697 for the constant sample-rate forecast. Extracted deal cards with market-implied probabilities cover 1,956 deals and score AUC 0.601. On 393 paired deals, including 22 breaks, removing the market input lowers AUC from 0.551 to 0.386 and produces a mean completion probability of 0.5006. Probability standard deviation falls from 0.1060 to 0.0321. On 770 paired cards, a separately tested riskier wording changes the mean completion probability by -0.0093. These are different selected samples; their AUCs are not a paired estimate of the gain from adding market information.