

Inside the Agent Lab
A live implementation of the AIA Forecaster paper, and what each pipeline stage actually does.

The Agent Lab currently assigns an 82% probability to the upper bound of the federal funds rate being above 3.00% after the April 2027 FOMC meeting. Kalshi trades the same question at 47%. On a different question — whether month-over-month core PCE inflation will print above 0.3% in April 2026 — the Lab is at 30%, and the market is at 51%, the disagreement running the other way.
The Agent Lab is our implementation of the AIA Forecaster (Alur et al. 2025) from Bridgewater AIA Labs — the multi-agent research pipeline, Chapter 24 of the third edition teaches end-to-end. It runs on live prediction-market questions, publishes a probability against each one, and persists every search result, agent trace, and intermediate aggregate to a database so that any run can be replayed against its original evidence.
This issue walks through what the Lab actually does. We are running it as a research experiment alongside the book, not as an institutional product, and the simplifications matter; we will name them as they come up.
What you see on a question page
The landing page lists featured questions across the US macro calendar — federal funds rate, core PCE, payrolls, and GDP. Each card shows the market price, the Lab’s forecast, a one-line agent-derived rationale, and a link to the full dossier.
The dossier is the part worth seeing. For a given question, it shows:
The distribution of individual agent probabilities for that run.
The probability trajectory as new daily forecasts accumulate.
The pipeline arithmetic — agents in, mean probability out.
The supervisor’s synthesis of the evidence with citations to the sources that the agents actually retrieved.
Run ID, generation timestamp, the model used for that run, and the number of search calls.
Every number is timestamped and attributable. This is the chapter’s position made operational: agents as engineering systems for evidence-rich decision support, with replayable traces rather than chat interfaces.
From Chapter 24 to running code
Chapter 24 walks the design space through ten notebooks: a ReAct loop, tool contracts and explicit state, a research agent, aggregation arithmetic, multi-agent research, adversarial debate, the full forecasting pipeline, and an evaluation/governance pass. The notebooks run deterministically in mock mode for teaching and CI, and switch to live providers and live search when the reader is ready.
The aia-forecaster repository (available at publication in June) takes the same architecture and runs it against live Kalshi and Polymarket questions. What the repo adds beyond the notebooks is the operational infrastructure: a SQLite run log with token-cost telemetry, market connectors with retry and filtering, an evaluation harness against historical resolutions, configuration profiles, and a scheduler for daily pull-and-forecast jobs.
How a forecast is built
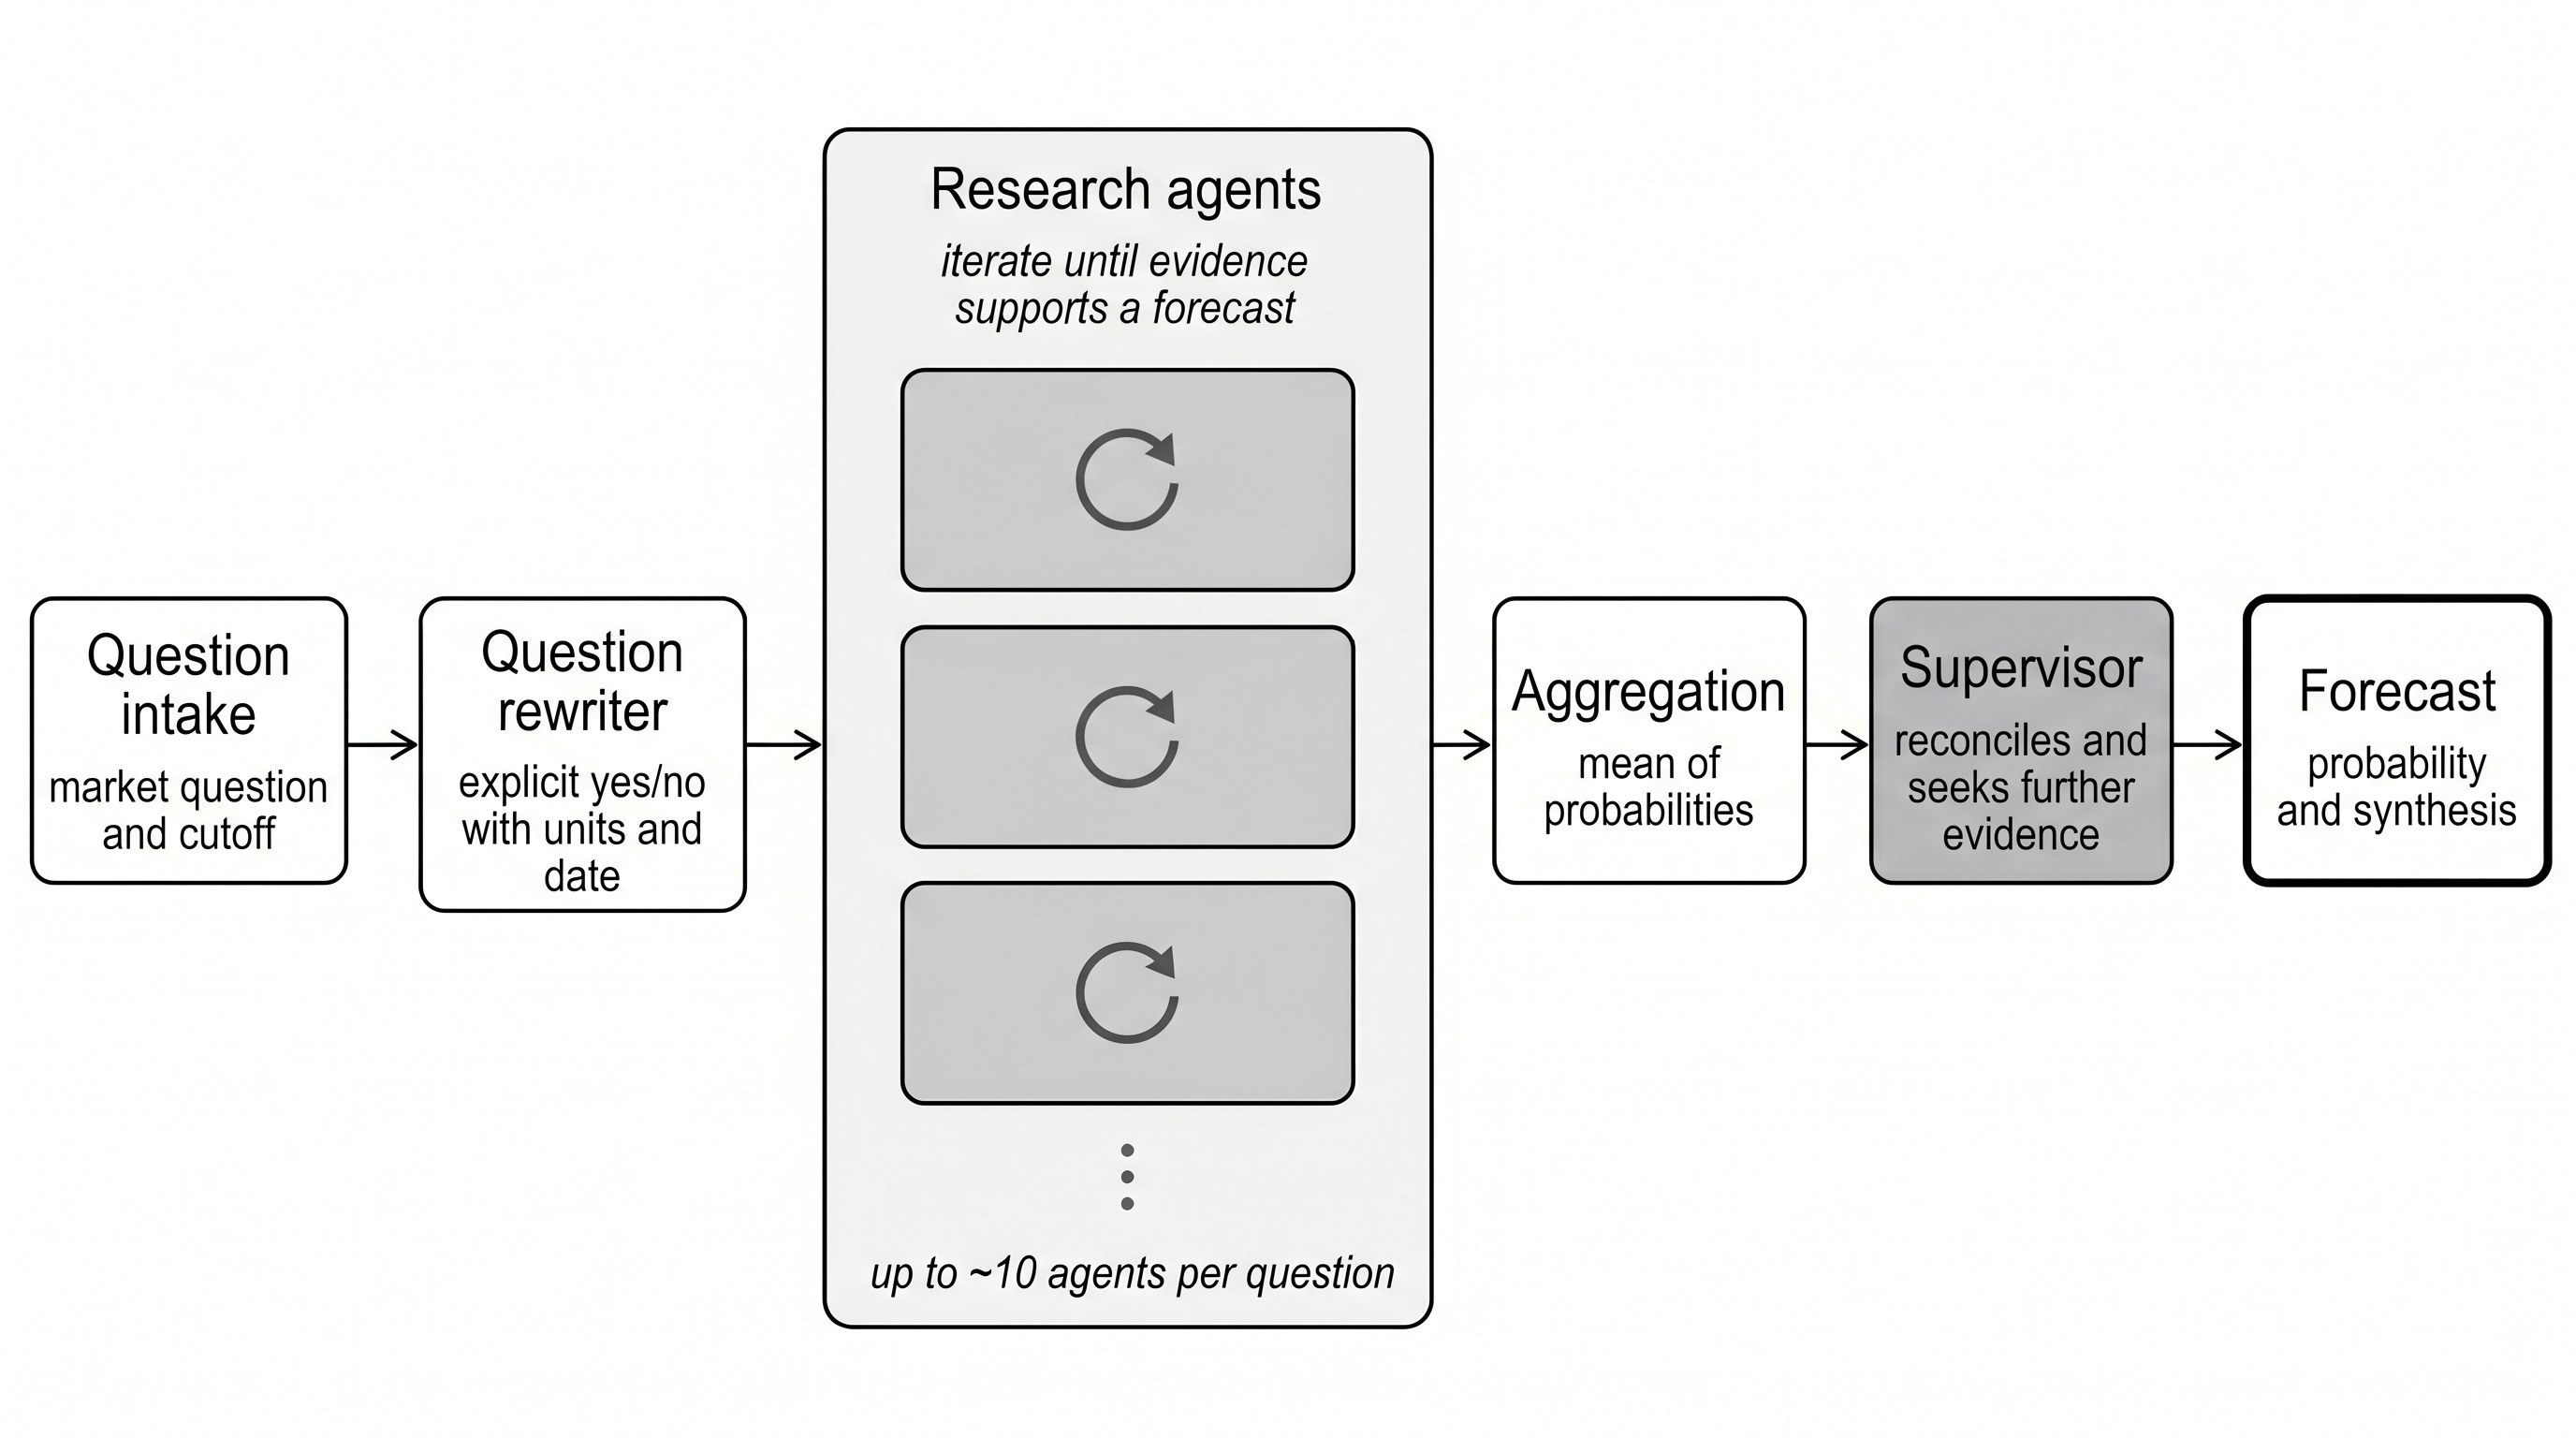
The AIA Forecaster pipeline — from market question to published probability.
For each market on each daily run, the Lab does the following:
Reword the question. Kalshi market titles are written for traders. The pipeline rewrites each one into a single explicit yes/no question that names the date, threshold, units, and resolution source. “Will the rate of core PCE inflation be above 0.3% in April 2026?” becomes the longer “Will the month-over-month percent change in core PCE be above 0.3% in April 2026, according to the Bureau of Economic Analysis?” The paper publishes this prompt verbatim in Appendix F. It does most of the work of preventing the units-and-time-frame mistakes a fast reader would make.
Run the research agents. Three agents run a ReAct loop in parallel over a search tool. They are identical: same prompt, same temperature, no role specialization. Diversity comes from stochastic sampling, not from prescribed roles. Each agent returns a probability and the evidence chain that produced it. (The paper’s production configuration uses ten agents on a frontier model; we run three on an open-source model. More on that below.)
Aggregate. The mean of the three agent probabilities is the ensemble forecast.
Supervisor pass. A separate agent reviews the ensemble against the market price and the agents’ rationales. It can override the ensemble — but only when its confidence in the override is explicitly high. Most of the time, it confirms.
Persist. The rewritten question, the search results, every agent trace, the aggregate, and the supervisor’s synthesis all land in SQLite, keyed by a run ID. Any run is replayable with its evidence held constant.
The point of step 5 is that nothing the Lab publishes is a black box. If a forecast looks wrong, the question is “which step produced it” — and the answer is in the database.
A note on two stages that look ordinary on the diagram but carry most of the system.
Search matters. On a batch of 64 live markets, the paper evaluates the same pipeline: Brier 0.1002 with search and 0.3609 without, worse than always predicting 50%, which mechanically scores 0.25. Each agent’s iterated search-and-reason loop is what produces the headline result.
The supervisor is not a judge. The paper tested a simpler “best of M” supervisor that reads the agents’ forecasts and picks the one it considers best, and it lost to the simple mean — selecting the worst of the M forecasts 7.2% of the time. The agentic supervisor’s gain comes specifically from running new searches to resolve disagreements, not from re-judging the existing answers. Naive verification underperforms averaging; only verification plus additional evidence beats it.
What the system is and is not
A few honest caveats about the version visitors see today.
Open-source model by default; three agents, not ten. The paper’s headline configuration runs ten agents per question on a frontier model. We run three agents on Qwen 3 (32 billion Parameters) — open-source, locally hosted, free at the margin — because a daily sweep on a frontier model with the full number of research agent iterations would cost on the order of $5/market/day. The price is paid in quality: an open-source model produces forecasts that illustrate how the pipeline works, not the numbers the paper produced - both web search and model quality matter materially. The same pipeline can run on Anthropic’s Sonnet — and we do occasionally use it for comparison sweeps — but the daily schedule uses Qwen.
It is not built to beat the market. The paper’s headline result is that AIA Forecaster matches a human superforecaster panel on ForecastBench — Brier score 0.075, statistically indistinguishable. On liquid prediction markets, the system underperforms the market consensus on its own. Instead, it produces independent information that improves on the consensus when combined with it. The paper formalizes this with a regression of resolution outcome on (market price, AIA forecast): even on the harder benchmark where AIA loses to consensus on its own, the optimal ensemble assigns roughly a third of its weight to the AIA forecasts, and the combined estimator beats either input alone. The Lab’s position is the same: a calibrated probability against each question, alongside the market price, not in place of it.
Calibration is currently off. Language models trained with RLHF tend to hedge toward the middle of the probability scale: even when the evidence supports an extreme forecast, the raw probability tends to be timid. The paper’s correction is Platt scaling — a logistic transform applied to each forecast as it is produced. The transform has one coefficient, which the paper sets a priori to √3, a value drawn from the calibration literature (Neyman and Roughgarden, 2022) rather than fitting it against the authors’ own benchmarks — a choice they explicitly make to avoid overfitting. With only three agents and open-weight models, the risk for us cuts the other way: extremization can amplify a wrong-side-of-50% forecast into a confidently-wrong forecast. The recent prompt rebuild already produces appropriately confident outputs, so we run with calibration disabled for now.
The forecasts move in both directions. On the Fed-rate questions in the opener, the Lab is well above the market. On core PCE, it is well below. The system is not built to take a contrarian view; it is built to produce an evidence-backed probability and let disagreement, in either direction, stand or fall in the face of resolution.
Read a dossier
Open the Agent Lab, pick a question where the forecast and the market visibly disagree, and read the dossier end-to-end. The agent distribution, the trajectory, the supervisor’s synthesis, and the search citations are all there. The next Insights issue lands Tuesday.