


Financial AI benchmarks now ask agents to retrieve filing evidence, explain calculations, assess a company’s funding, build financial models, and reproduce trading strategies. These tasks reveal more than a leaderboard: they show which parts of a research workflow are tested and what a high score rewards.
This article works through six examples, from a single cash-flow figure to executable trading code. Each has a different work product and a different way to decide whether it is correct. One released reference answer also illustrates why the evaluator itself deserves inspection.
The ML4T evaluation catalog provides the broader resource map. Here, the aim is to make a few of those resources concrete enough to judge whether they fit the work you want an agent to do.
The broader benchmark landscape
The table groups evaluations by the work they test and what their scores establish. The categories overlap; benchmark suites can cover several rows.
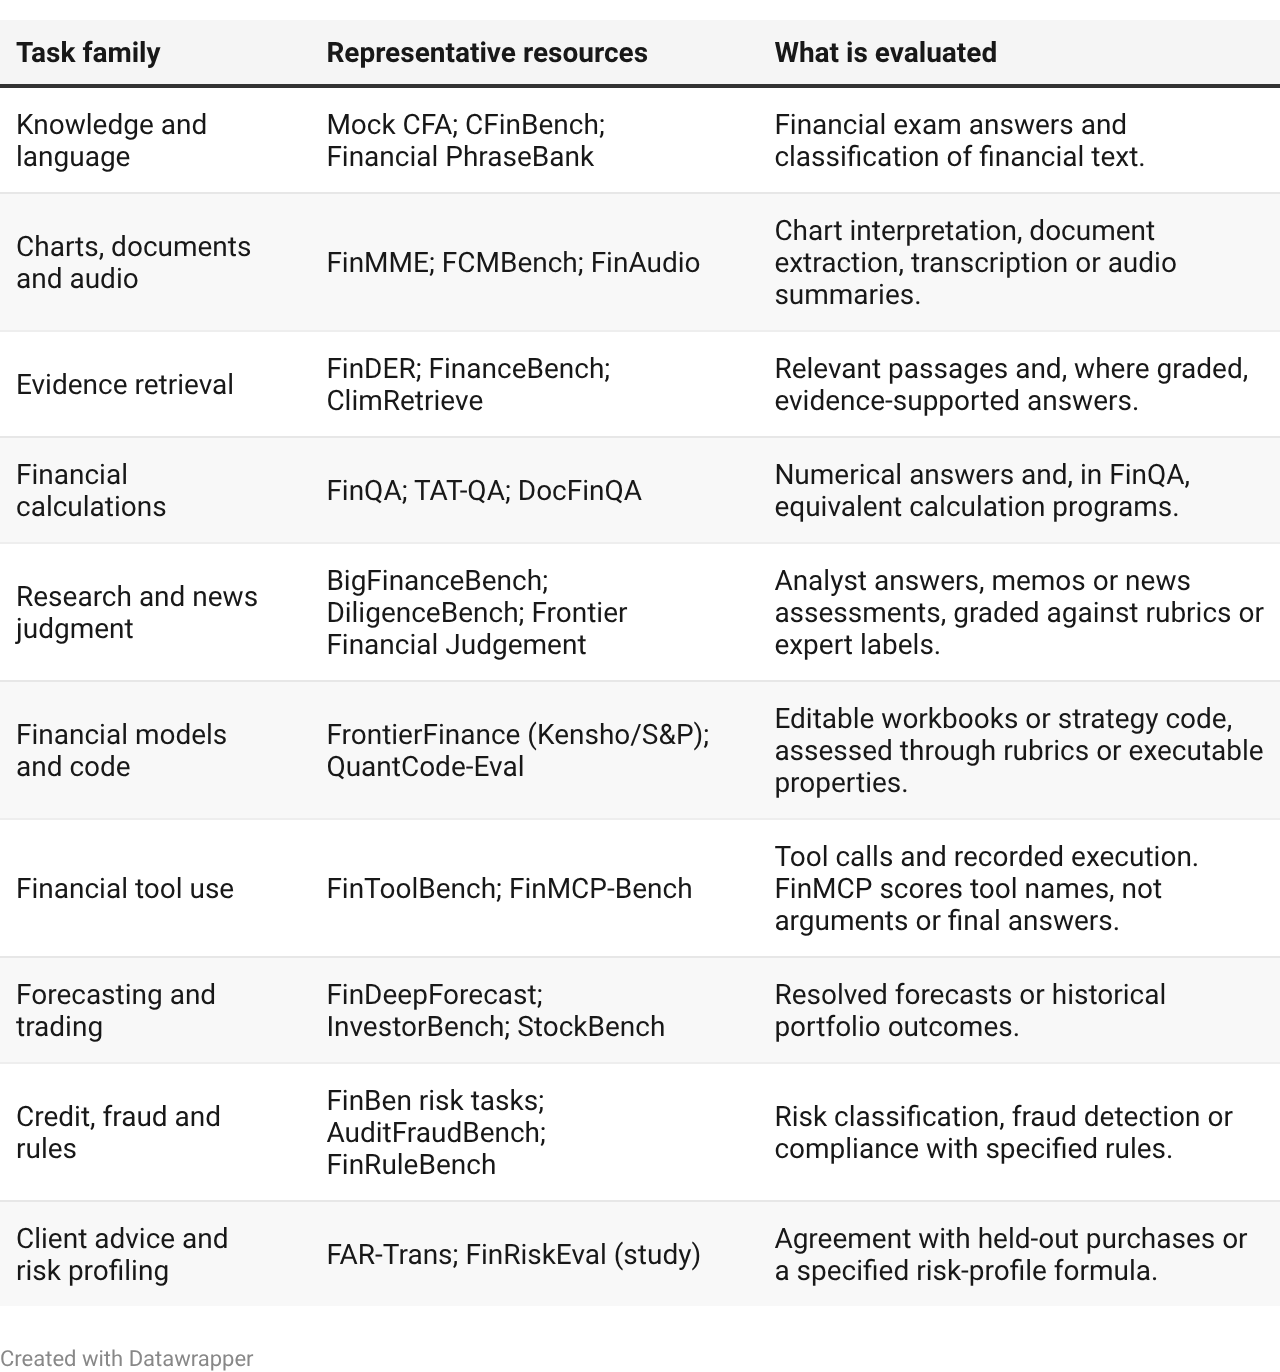
Task families across the ML4T evaluation catalog, which contains 66 benchmark records within 91 resources. Suites and component datasets are separate resource types. Examples are starting points, not rankings. Climate, language, jurisdiction, privacy, and information timing cut across these task families.
Free live lesson · How to use AI Research Agents for Trading Strategy Design
On October 28 at 11 a.m. Eastern, my free Trading Strategy Research lesson shows a research agent running an ETF experiment and what to check before trusting its result.
For hands-on work building, evaluating, and deploying a multi-agent system, join the Agent Engineering workshop on November 21, with an early-bird discount through October 31.
FinanceBench: find the right figure and its evidence
FinanceBench includes questions grounded in company reports, with reference answers and supporting passages. A public example asks how much 3M spent on capital expenditure in fiscal 2018 and directs the agent to the cash-flow statement. The reference answer is $1,577 million; its evidence is the cash-flow statement’s purchases of property, plant and equipment.
This is a small task with several ways to go wrong. An agent must select the right reporting year, recognize that the table is in millions, and locate the purchases-of-PP&E line in the statement the question names. The statement displays the purchase as a negative cash flow. The answer reports the expenditure’s positive magnitude.
An answer can therefore contain the right-looking number while citing the wrong year, omitting units, or pointing to a passage that doesn’t support it. The released evidence lets a reviewer check those distinctions rather than rely on the prose’s plausibility.
For someone building a filing assistant, the task is directly relevant. It also suggests a useful diagnostic: compare answers produced from the whole report with answers produced after supplying the correct passage. That comparison can help separate a retrieval problem from a failure to interpret the evidence.
FinQA: make the arithmetic inspectable
FinQA adds a reference calculation to questions about financial tables and text. In one example from Entergy’s 2008 filing, the supplied table concerns Entergy Louisiana. Net revenue falls from $991.1 million in 2007 to $959.2 million in 2008, and the question asks for the growth rate.
The calculation is:
(959.2 - 991.1) / 991.1 × 100 = -3.22%
The reference answer rounds this to -3.2%. Its program first subtracts the prior year’s revenue, then divides by that prior-year value. This makes the denominator and the direction of the change explicit.
The FinQA paper distinguishes execution accuracy from program accuracy. Execution accuracy asks whether the calculation produces the correct numerical result. Program accuracy checks mathematical equivalence with the reference after replacing arguments with symbols, allowing some differently expressed calculations to count as equivalent.
A research assistant that supplies a calculation is easier to inspect than one that supplies only a percentage. A reviewer can locate a wrong denominator, a unit conversion, or an incorrectly selected input. But inspecting the program does not establish that the inputs belong to the intended company, segment, or period. In this example, labeling the figures as consolidated Entergy revenue would misdescribe an otherwise correct calculation.
BigFinanceBench: inspect the derivation, including the reference
BigFinanceBench uses expert-authored financial questions and item-specific scoring criteria. Its public subset lets you inspect the intermediate facts and calculations that earn credit, along with the final answer.
One released task asks for the change in Roku’s Platform gross margin between 2023 and 2024 after adjusting cost of revenue for restructuring expenses. The rubric awards points for finding revenue and costs, making the adjustment, computing both margins, and expressing the change in basis points.
The released inputs, in millions, are revenue of 2,994.105 and adjusted cost of 1,360.514 for 2023, followed by revenue of 3,522.776 and adjusted cost of 1,636.816 for 2024. Applying gross margin as revenue less cost, divided by revenue, gives:
2023:
1 - 1,360.514 / 2,994.105 = 54.56%2024:
1 - 1,636.816 / 3,522.776 = 53.54%
Using the unrounded margins, the change is approximately -102 basis points. The released reference instead gives positive 102 basis points. The rubric’s intermediate percentages, 45.44% and 46.46%, reflect cost divided by revenue, not gross margin. Consequently, the gross-margin change is reversed. Those three mistaken criteria account for 16 of the item’s 27 available points. The question itself asks for an “uplift”, presupposing an increase that the calculation contradicts.
Roku’s 2024 filing corroborates the revenue, reported cost, and 2023 restructuring figures. It also records a $3,000 restructuring credit in 2024, whereas the rubric uses zero; adjusting for that credit does not change the rounded -102-basis-point result.
This is a reference-answer inconsistency in the inspected release, not a measured error rate for the benchmark. No agent was run for this article. It matters because an evaluation that rewards agreement with the released reference could penalize the correct direction. Intermediate scoring criteria make the discrepancy easier to locate: you can check the source values, formula, and sign separately.
For a practitioner, that transparency is a reason to inspect the release before selecting a benchmark. It also lets you challenge the score and the agent.
DiligenceBench: assess a short research judgment
DiligenceBench, from Paper Instruments and Thoughtful Lab, asks for open-ended equity research assessed against weighted criteria. Its Capital One example requests a conclusion-first executive summary of three to five sentences about funding quality and repricing risk, with material assumptions and the most uncertain assumption identified.
The prompt describes cheaper deposits, deposit growth, no long-term debt issuance, and a change in net interest income’s sensitivity to a rate shock. The task is to explain how these observations fit together. Cheaper deposits can improve funding economics; replacing longer-term borrowing with deposits can also change how quickly funding costs reprice.
The published rubric rewards factual accuracy, analytical reasoning and risk awareness. This tests whether a short memo supports its conclusion, recognizes competing implications, and identifies missing information. A list of correct figures would leave much of that work undone.
For teams using agents to draft investment research, these grading criteria are a starting point for defining reviewer expectations. Their interpretations still require scrutiny: a weighted rubric formalizes a particular assessment of the evidence, and a model-based grader must decide whether the memo satisfies it.
FrontierFinance: deliver a model someone can use
FrontierFinance, from Kensho, S&P Global and MIT, evaluates financial modeling through computer use. The paper includes a complete Electronic Arts leveraged-buyout task and a detailed scoring rubric.
The work product changes the evaluation. A spreadsheet needs linked formulas, consistent assumptions, and an intelligible structure. A collection of pasted numbers can look finished while failing to support further analysis. The paper’s general grading framework explicitly treats outputs with only static values, without formula logic, as invalid; its Electronic Arts rubric also makes correct filing and the fiscal period a condition for proceeding to scoring.
For example, if a user changes a revenue-growth assumption, they expect the dependent calculations to update.
This benchmark is relevant when the intended deliverable is a reusable financial model. Its rubric also assesses the justification for revenue forecasts, margins, and other assumptions. Passing the formula-validity gate alone does not establish their economic quality.
QuantCode-Eval: reproduce the strategy’s implementation
QuantCode-Eval moves from financial analysis to code. Its public task release contains strategy-reproduction instructions and executable checkers.
The adapted time-series momentum task, T01, requires a Python implementation with separate functions for data preparation, returns, volatility, signals, positions, and portfolio returns. Its strategy digest specifies a 12-month signal and volatility-based position sizing. The B5 checker feeds synthetic prices to the volatility function and compares selected outputs with one-month-lagged reference estimates.
This checks a specific convention that simply running the script would not verify. It does not test the complete sizing or trading pipeline. The task separately specifies that signals and position sizes indexed at a month-end are applied to the following month’s return. Assessing look-ahead bias requires checking that full alignment; violating the extra volatility lag alone does not establish that future information was used.
For systematic researchers, this is a more relevant coding test than asking an agent to write a plausible strategy explanation. It can reveal whether the agent follows the specified signal construction, information timing, and aggregation rules. Passing the checks provides evidence of compliance with the tested requirements, not that the strategy will earn future returns.
Access also affects what we can reproduce. The release supports checker evaluation of shipped strategy artifacts without licensed source panels. Reconstructing input panels and rerunning reference strategies is a separate matter: ten tasks, including T01, are self-contained, while twenty require Wharton Research Data Services (WRDS) entitlements. A researcher can therefore inspect more of the evaluation than they can necessarily reconstruct from source data.
Choose the test from the work product
These examples cover related capabilities but don’t form a single ranking of financial intelligence. A filing answer, a calculation, a research judgment, a workbook, and a strategy implementation need different evidence of success.
The practical starting point is the deliverable you intend to use. If an agent drafts memos, look at whether the assessment covers the reasoning and uncertainty your reviewers care about. If it produces spreadsheets or code, inspect the formulas and executable checks. Then examine a few actual tasks, reference answers, and grading decisions before relying on the aggregate score.
The ML4T Agent Lab evaluation resource connects the catalog to individual benchmark pages and the longer research synthesis. It can help locate candidate tests; the released tasks show what those tests would actually ask of your system.
Sources and public releases checked October 27, 2026. Task descriptions are paraphrased. We recalculated the arithmetic above; we did not run an agent benchmark or strategy backtest for this article.